Taboola Ads ROI in 2026: Is It Paying for Itself?

Taboola Ads ROI measures what native campaigns return for every dollar of media spend, once fees, creative time, and tracking gaps are counted. Most advertisers reach a positive return inside the first year, though timing depends on conversion volume and how fast creative gets refreshed. Whether it pays for itself comes down to measurement discipline more than budget size.
Why Trust Us on Taboola Ads ROI
Our 28 specialists bring 190 plus years of combined marketing experience across 180 plus campaigns. We’ve funded native tests in 14 industries, so these ranges come from spend we managed.
Need Help With Taboola Ads ROI?
Reach out if native spend is climbing faster than conversions, and we’ll start with your account data. Audience testing, creative refresh, and conversion tracking sit inside our Taboola Ads management work.
The rest of this post covers how to calculate the return, what healthy looks like early, and where money quietly leaks out. Every number comes from our own campaign records unless a source is linked.
What Does Taboola Ads ROI Measure?
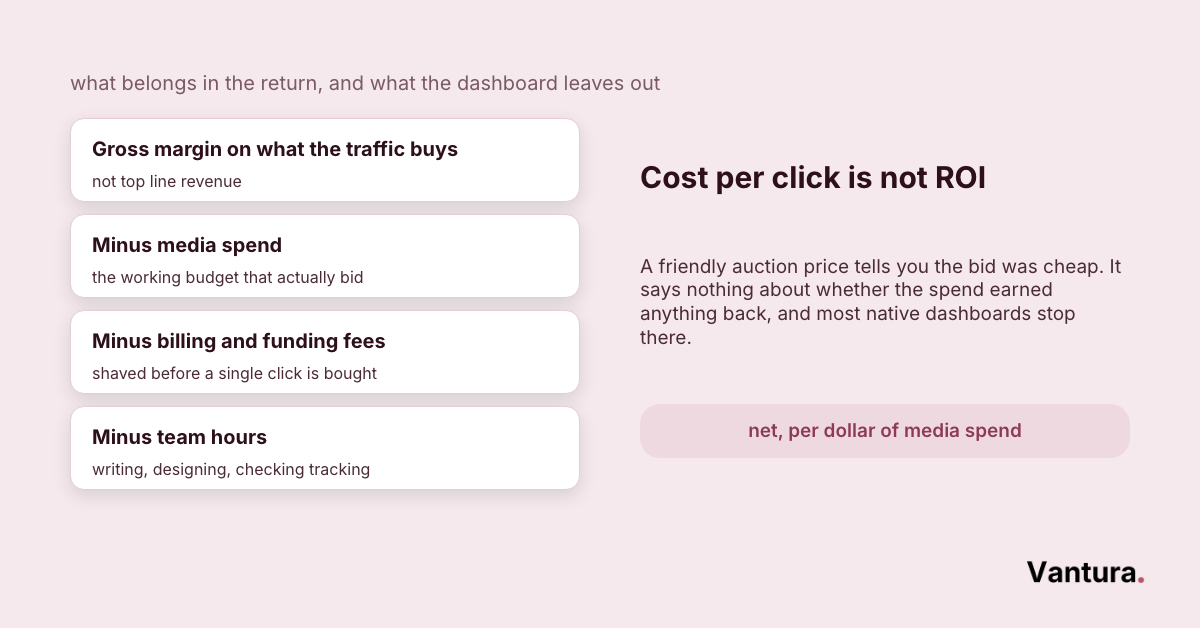
Taboola Ads ROI is the profit your native campaigns return per dollar of media spend, after billing fees and the hours behind creative and reporting. It’s a net figure, so cheap clicks and a losing campaign can sit side by side.
Most reporting stops at cost per click, and that’s where the confusion starts. A low click price tells you the auction is friendly, not that the spend is earning anything back.
Three things get left out of almost every native dashboard we inherit. Adding them back usually moves the reported return by a wide margin.
- Billing and funding fees that shave the working budget
- Gross margin on what the traffic buys, not top line revenue
- Team hours spent writing, designing, and checking the tracking
Return only means something against a goal you set first, fixed before a single dollar goes live. A campaign judged after the fact always looks either brilliant or terrible.
Worth knowing: A native campaign is a discovery channel, so the first click rarely closes the sale. Judge it on assisted revenue over a full purchase cycle, not on last click alone. Cut it in week two and you’ll kill a campaign that’s still doing its job.
How Do You Measure Taboola Ads ROI Step by Step?
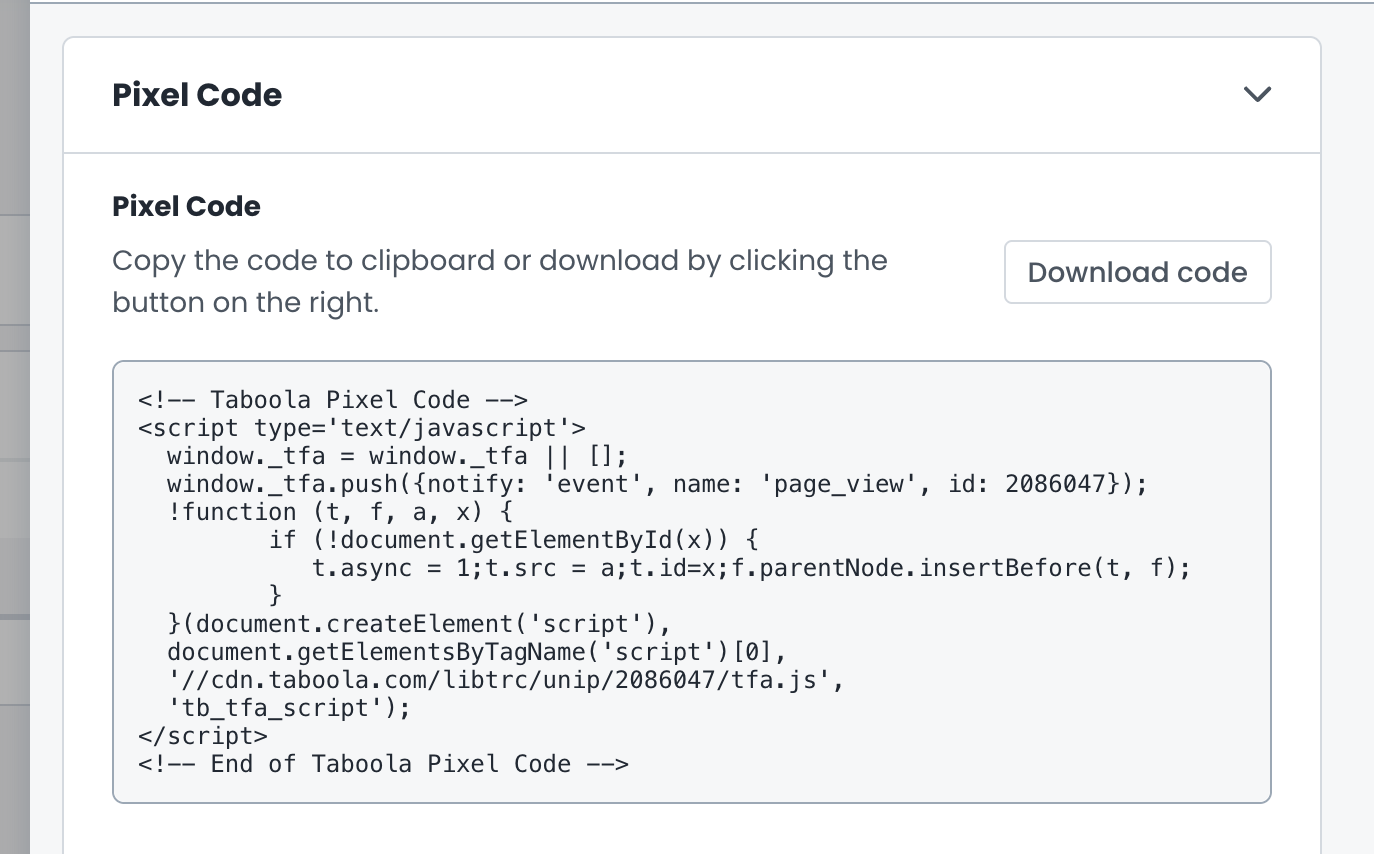
Measuring Taboola Ads ROI takes four passes. Set the money goal, install clean tracking, hold the budget steady long enough to learn, then compare margin against total cost rather than media cost.
Step #1: Pick the number you’re buying
Decide what one conversion is worth to the business before launch. A signup, a booked demo, and a first order all carry different margins, and mixing them turns the report into noise.
We ask clients for the gross margin figure, not the revenue figure. That single swap has flipped the verdict on more than a few accounts we reviewed after someone else ran them.
Step #2: Install tracking you can defend
Taboola’s pixel documentation covers a Shopify app, a WooCommerce route, a WordPress plugin, Google Tag Manager, and manual installation. Server side tracking runs alongside pixel tracking, the same range of options we map out in Taboola Ads integrations work. Pick one route and document it.
Half the accounts we audit have two tracking methods firing at once. That’s how a client ends up double counting every purchase and reporting a return that never existed.
Step #3: Fund the learning period properly
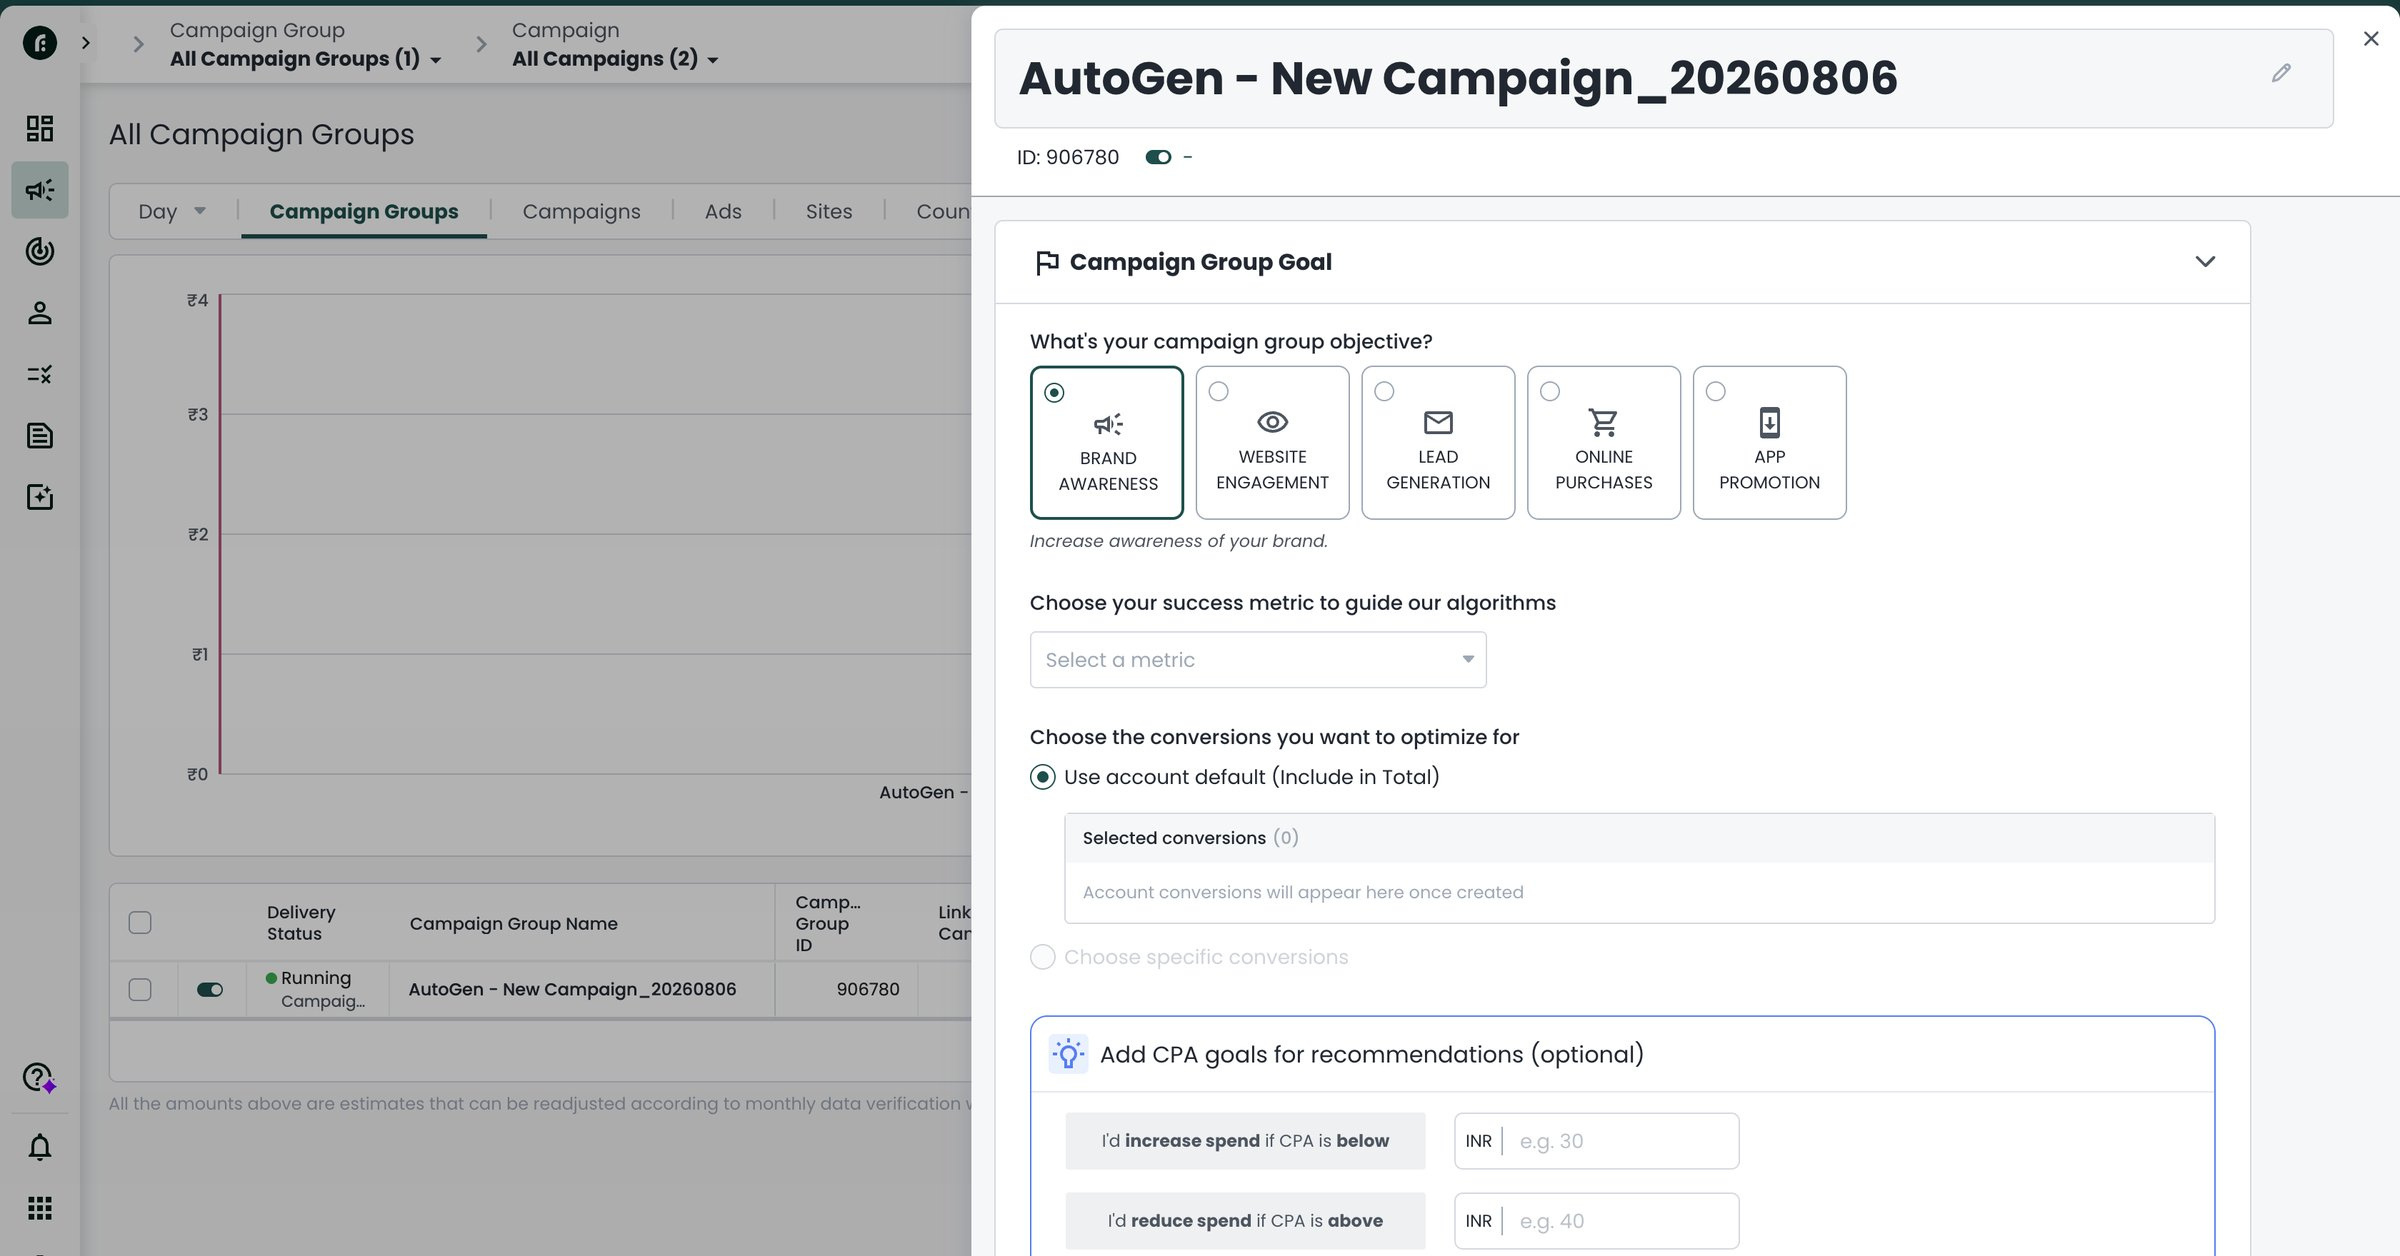
Taboola’s own budget guidance ties the daily figure to roughly ten times your target cost per action. That way the system sees enough conversions each day to learn. Below that, the data thins out and results wobble.
Starving a test is the cheapest way to get a useless answer. In our experience a campaign funded at half the recommended floor takes about twice as long to produce a reading anyone trusts.
Step #4: Compare margin against total cost
Add media, funding fees, and internal hours, then divide gross margin by that total. The result is the number your finance team will recognize as return.
Run the same calculation monthly with the same inputs. A quiet change in what those inputs mean is usually why last quarter’s report no longer matches this one.
Average Taboola Ads ROI by Company Size and Industry
There’s no published industry average worth quoting here, so the table below comes from our own accounts. Treat it as a shape to expect, not a promise.
| Advertiser profile | Typical monthly native budget | Where returns land by month three | Main drag we see |
|---|---|---|---|
| Small ecommerce brand | Low four figures | Near break even on first order, positive on repeat purchases | Thin creative library |
| Mid market lead generation | Mid four to low five figures | Roughly 20 to 30 percent above target cost per action, then at or under it | Weak lead qualification |
| Consumer subscription | Low five figures | Positive once trial to paid rates hold steady | Early cancellations |
| Business software | Mid four figures | Pipeline value clears spend around month four | Long sales cycle |
| Publisher or media brand | Low four figures | Positive on ad revenue per session | Shallow session depth |
Industry matters less than margin. A store with 70 percent gross margin and a store with 20 percent can run the same campaign. They’ll reach opposite verdicts on the same cost per action.
Retail accounts tend to read fastest because purchases are same session. Our ecommerce accounts usually know inside three weeks, while considered purchase categories need a full quarter.
What Does a Healthy Taboola Ads ROI Look Like in Year One?
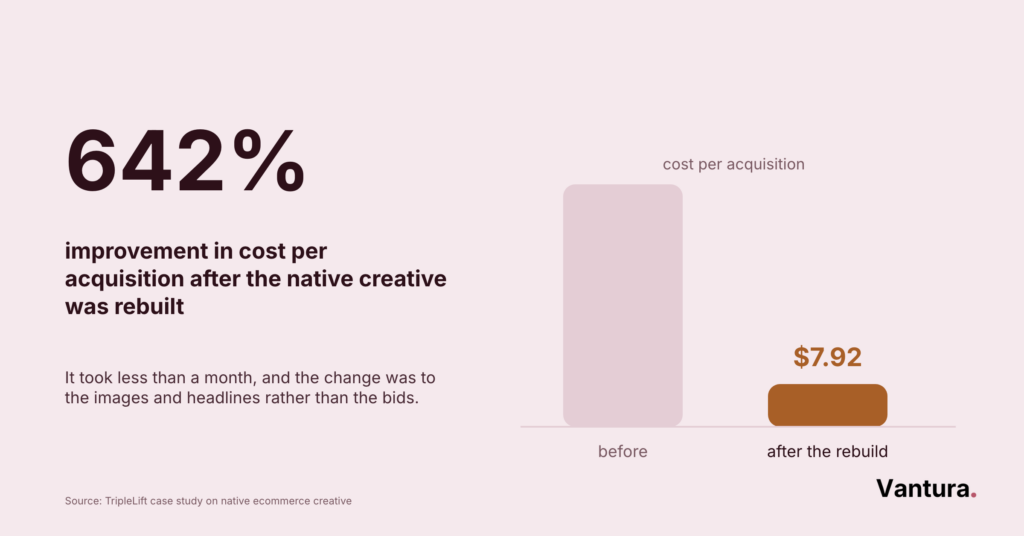
A healthy first year moves through three stages. Costs run high while the system learns, settle near your target by the second quarter, then improve as creative and audience data compound.
We used to promise clients a clean upward line. After enough launches we stopped, because the honest picture is a saw tooth that only trends up when you zoom out to a quarter.
- Months one and two run above target cost per action
- Months three and four should land near target
- Months five onward should beat it by a modest margin
- Any month with new creative resets part of the curve
Consumer brands see the pattern most clearly because purchase cycles are short. Across our health and wellness accounts, the second quarter is usually where the finance conversation stops being defensive.
Which Hidden Taboola Ads Costs Quietly Cut Your ROI?
The media invoice is rarely the whole cost. Funding fees, creative production, and the hours spent reconciling reports all come out of the same return, and none of them appear in campaign reporting.
Funding method is the one advertisers miss most often. Taboola’s billing documentation puts the credit card prepayment processing fee at roughly 2.5 to 3.5 percent depending on region. A 100 dollar top up lands closer to 97 dollars of usable budget.
That option is also limited by account type, since card prepayment is available to pre pay and credit limit accounts rather than automatic billing accounts. Worth checking before you model a return on the full deposit.
- Processing fees on prepaid top ups
- Creative production for a channel that burns assets fast
- Landing page builds the ads need but the site lacks
- Analyst hours reconciling native data against your own numbers
Internal hours are the quietest cost of all. Teams that price them honestly often find the outsourced version costs less than the one they were already running.
Budget check: Before your next quarter starts, add funding fees, creative production, and analyst hours to the media number and recalculate. Most teams find the real cost sits noticeably above the invoice, which changes what a winning cost per action needs to be.
How Can You Lift Your Taboola Ads ROI in the First Year?
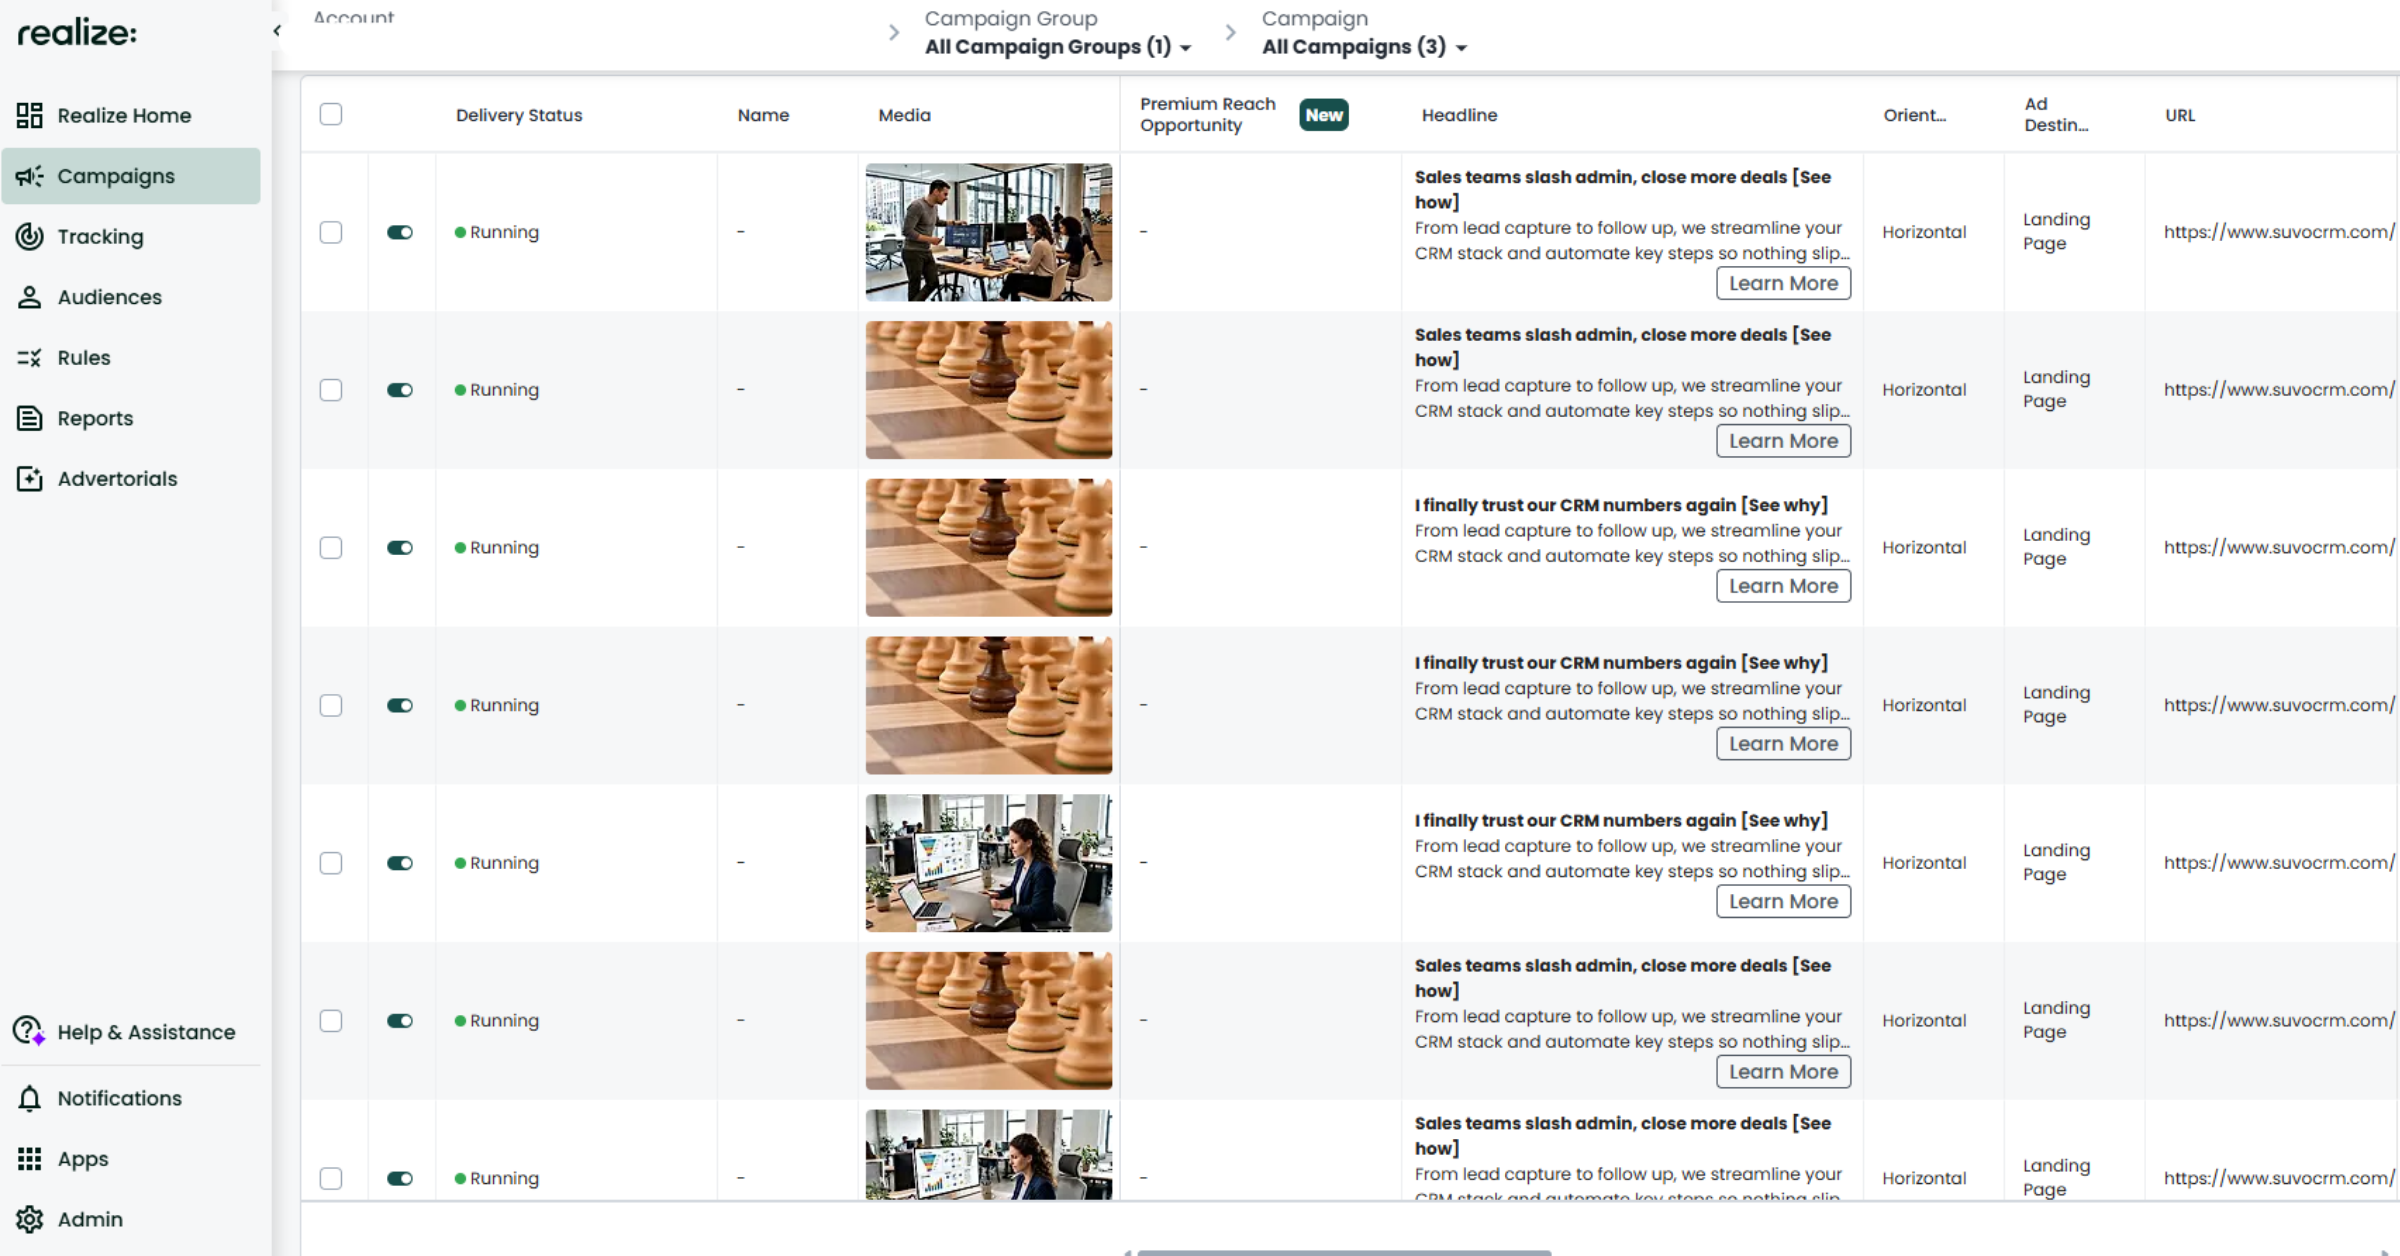
Four levers move the number faster than anything else. Refresh creative on a schedule, tighten what counts as a conversion, match landing pages to the ad promise, and stop touching bids daily.
Refresh creative before performance sags
Native creative fatigues faster than search copy because the same readers see it across a publisher network. We plan refreshes on the calendar rather than waiting for the click rate to drop.
A rotating set of images and headlines usually holds cost per action steadier than one hero asset everyone loved in the kickoff meeting. That was a hard lesson on a subscription account where the winning ad stopped working in its fifth week.
Fix what you count before you fix what you bid
Optimizing toward a soft conversion trains the system to find people who do the soft thing. Newsletter signups are easy to buy and often worth very little.
Point the campaign at the action that carries margin, even when volume drops. Clients who bring in Taboola Ads consulting usually need this change before any bidding change is worth making.
Leave the campaign alone long enough to learn
Daily bid edits reset the learning the system is trying to do. Pacing choices matter here too, since front loaded spend raises the daily budget by about 20 percent and burns through a flight faster.
We hold changes to one adjustment a week during the first month. It feels passive, and it produces cleaner reads than the alternative.
Test this first: Run one week where nobody edits bids, budgets, or targeting, and simply record the daily cost per action. The stability you see, or don’t, tells you whether the account has a performance problem or a management problem.
Taboola Ads ROI by Campaign Type, Pacing, and Billing Setup
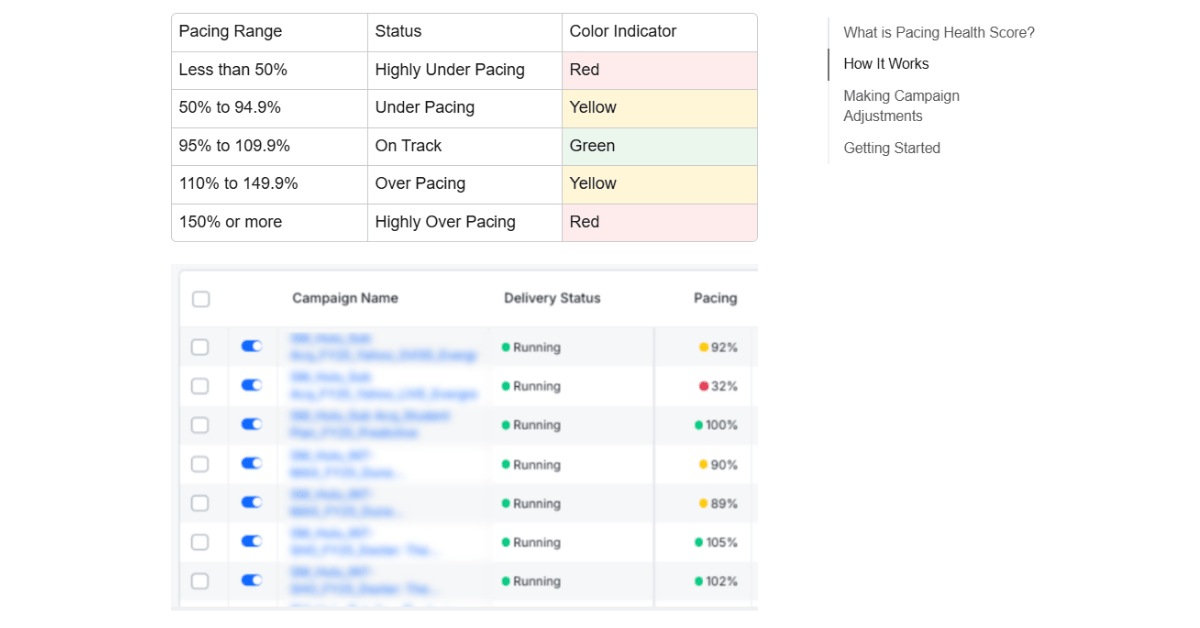
Different setups produce different returns for the same money. The table below maps the choices that change the arithmetic most, based on how the account is configured rather than what it sells.
| Setup | What it optimizes for | Effect on return | Watch for |
|---|---|---|---|
| Traffic campaign | Clicks and sessions | Weak direct return, useful for building retargeting pools | Sessions that never scroll |
| Conversion campaign with the pixel live | Actions on your own site | Strongest direct return once daily volume is there | Budget set below the recommended floor |
| Default pacing | Even spend across the flight | Steadier cost per action, slower learning | Underspend on short flights |
| Front loaded pacing | Faster data, about 20 percent more spend per day | Quicker learning, choppier early returns | Budget gone before the flight ends |
| Prepaid funding | Nothing, it is a funding method | Processing fee trims usable budget | Regional fee differences |
| Credit limit funding | Nothing, it is a funding method | No processing trim on top ups | Approval time before you can launch |
Larger advertisers usually land on credit limit funding and conversion campaigns with steady pacing. That combination is closer to what an AdRoll comparison would recommend for accounts this size, and finance teams can reconcile it without a monthly argument.
How Does Taboola Ads ROI Compare With Other Native Ad Networks?
Native and paid social buy attention in different states of mind, so their returns are not directly comparable. Native reaches readers mid article, while social reaches people mid scroll, and the follow up behavior differs.
Where each channel tends to earn its budget
We run both for most clients and split the goals rather than the credit. The tabs below show what each one reliably does well in our accounts.
- Reaches readers already consuming long form content
- Cheaper session cost, longer time on page
- Returns build over weeks, not days
- Rewards article style landing pages
- Reaches people between posts, with shorter attention
- Faster feedback, sharper creative fatigue
- Stronger retargeting and lookalike controls
- Rewards short video and offer led creative
Comparing the two on last click alone almost always flatters social, because it sits closer to the purchase. The same distortion shows up in any Outbrain comparison, and the fix is a shared view of assisted conversions.
How Do You Show Your CFO the ROI of Taboola Ads?
Give finance one page with three things. Total cost including fees and hours, gross margin generated, and the payback window in months, using their definitions rather than the ad account’s.
Marketing dashboards fail this conversation because they report impressions and clicks. A finance team wants to know when the money comes back and how confident you are in the answer.
- Total cost: media, funding fees, production, and internal hours
- Return: gross margin from tracked and assisted conversions
- Payback: the month cumulative margin passes cumulative cost
- Confidence: how much of the result is modeled rather than measured
That last line buys more credibility than any chart. Being open about the modeled share is what keeps budget approved through a soft quarter. We lean on that hard in finance accounts reviews where pipeline lags spend by months.
Boardroom note: Bring the same four lines every month, even the months that look bad. A report whose format changes with the result reads as an argument, and finance teams discount it accordingly.
Which Mistakes Ruin Taboola Ads ROI Tracking?
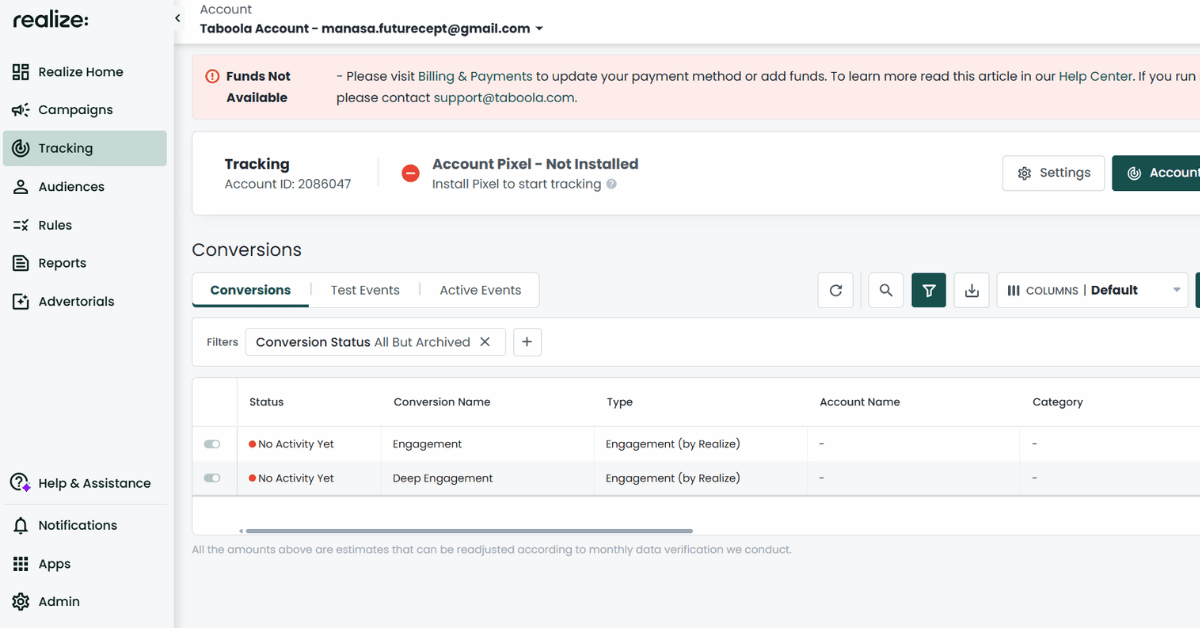
Most broken ROI reports come from measurement, not media. The five below account for nearly every account we’ve had to rebuild.
- Two tracking methods firing, so conversions count twice
- Judging a discovery channel on last click only
- Counting revenue instead of margin
- Changing the conversion definition mid quarter
- Leaving funding fees and internal hours out of cost
The mid quarter definition change is the sneakiest one. Someone adds a new event, the conversion count jumps, and the account looks like it improved when nothing about the media changed.
A written measurement plan prevents most of this. We build one at the start of every engagement and treat any change to it as a versioned decision, not a quiet edit.
The Metrics and KPIs to Put in a Taboola Ads ROI Report
A useful report has six lines, not sixty. Each one should answer a question someone will ask in the meeting.
| Metric | What it tells you | Where it comes from | How often to review |
|---|---|---|---|
| Cost per action | Whether bidding is landing on target | Campaign reporting | Daily while learning, then weekly |
| Conversion rate by campaign | Whether the landing page matches the ad promise | Site analytics | Weekly |
| Margin per session | Whether the traffic carries real value | Store or CRM data | Monthly |
| Blended cost per acquisition | Whether native adds customers or shifts them | Finance and analytics combined | Monthly |
| Creative decay rate | When assets need replacing | Click rate trend in reporting | Every two weeks |
| Payback window | When spend turns into profit | Finance | Quarterly |
Blended cost per acquisition is the line most teams skip and the one that settles arguments. If native grows and blended cost falls, the channel is adding customers rather than moving them between reports.
How Long Does It Take Before Taboola Ads Pays for Itself?
Payback usually lands between month three and month five for retail and consumer accounts, and closer to month six for considered purchases. Faster than that normally means the tracking is generous.
Two things set the pace. Daily conversion volume decides how quickly the system learns, and purchase cycle length decides how quickly you can see the result.
Accounts that fund the recommended daily floor reach a verdict in about half the time of accounts that trickle spend in. Working with a Taboola Ads agency mostly shortens the front end, since the tracking and creative pipeline are ready on day one.
Patience pays here: Set the review date before you launch and put it in the calendar. Teams that agree on a month four verdict in advance rarely kill a campaign in week three. That single decision protects more returns than any bidding change.
What Does Taboola Ads ROI Look Like at Three Company Sizes?
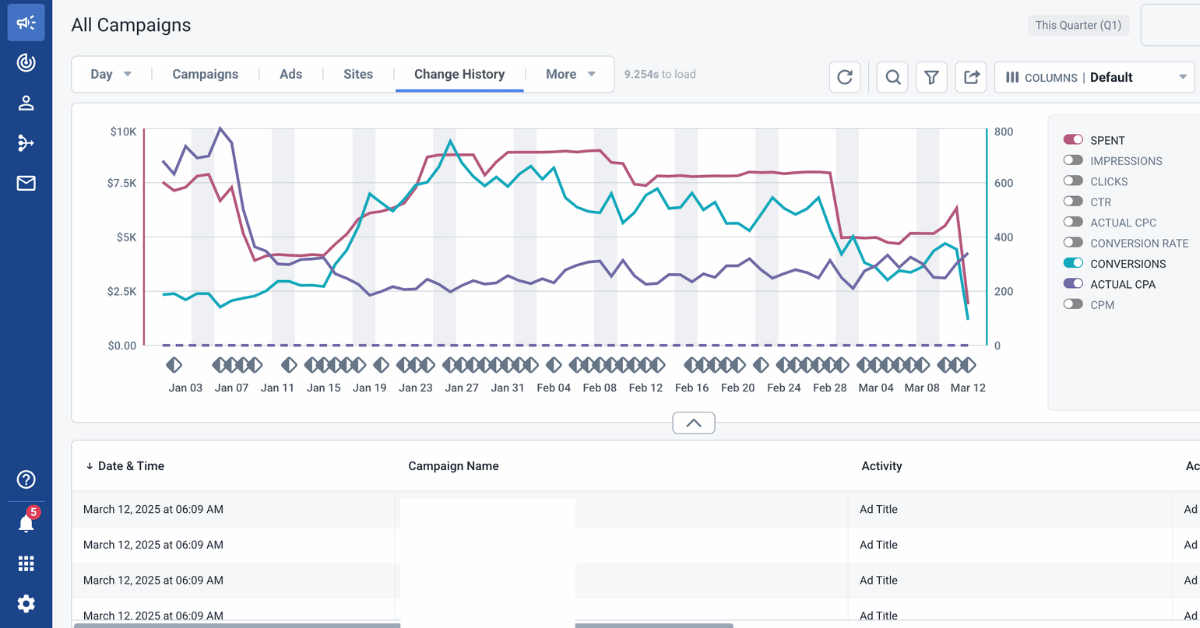
The same channel behaves differently depending on how much budget and how many people sit behind it. These three patterns show up again and again in our accounts.
The owner run business
Budget is small, creative is homemade, and the founder checks the account daily. Returns are usually fine on paper and terrible once their own hours are priced in.
The fix is fewer campaigns and a longer hands off window. That’s the first change we make in these accounts before touching anything else.
The mid market marketing team
There’s enough budget to learn and enough people to argue about attribution. Returns are typically solid, and the reporting is where the trouble lives.
One shared definition of a conversion usually settles it. We’ve watched a team spend six weeks debating a channel that was already profitable under any of the three definitions in play.
The large advertiser
Spend is high, approval cycles are slow, and creative refreshes get stuck in review. The return is decent but capped by how fast the organization can move.
Pre approving a creative rotation is worth more here than any bidding tweak, an edge that shows up clearly in any Criteo comparison of enterprise budgets. It’s an unglamorous change that lifts the number more reliably than clever targeting.
When Is Taboola Ads the Wrong ROI Choice for You?
Native is the wrong bet when your audience is tiny, your margin is thin, or you need results this week. It’s a discovery channel, and discovery takes volume and time.
We’ve told clients to skip it more than once. A local service business with a small radius rarely gets enough qualified reach to make the arithmetic work.
- Your addressable audience is one city or smaller
- Gross margin sits in the low double digits
- You need a verdict inside 30 days
- Nobody owns creative production
- Conversion tracking is not installed or verified
Visual products with a discovery habit often do better elsewhere, and we’d rather walk through Taboola alternatives up front than spend a quarter proving native isn’t the fit.
What Are the Signs Your Taboola Ads ROI Is Falling?
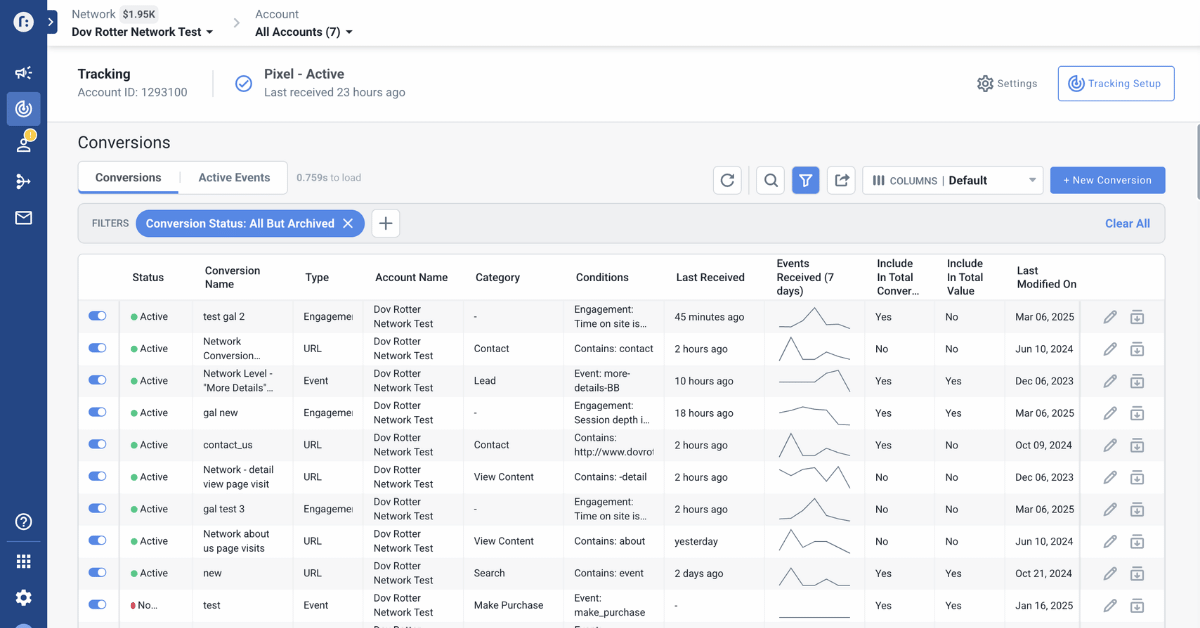
Declining returns announce themselves weeks before the monthly report does. Three signals are worth watching closely.
Sign #1: Click rate slides while cost per action holds
This is creative fatigue arriving early. The cost figure looks stable because volume is dropping at the same rate as spend.
Sign #2: Conversions concentrate in fewer placements
A narrowing set of publishers means the system has run out of fresh audience. Returns usually hold for a few weeks, then fall quickly.
Sign #3: Assisted conversions drop before direct ones
Native contributes to journeys it doesn’t finish, so the assisted line moves first. When it falls for two straight weeks, the direct line follows.
Early warning: Put assisted conversions and placement concentration on the same weekly view as cost per action. Both move earlier than the headline number, which gives you a few weeks to refresh creative instead of explaining a bad month afterwards.
Taboola Ads ROI FAQ
If your own numbers look nothing like the ranges above, the gap is usually measurement rather than media. Get in touch and we’ll start by reconciling what the account counts against what your finance team counts.
Disclaimer: This post is for general information only and does not constitute financial, legal, or business advice. Product details and fees may change, so verify current terms with the provider. Vantura Marketing accepts no liability for decisions made based on this content.