Construction Marketing Analytics: KPIs & Dashboards

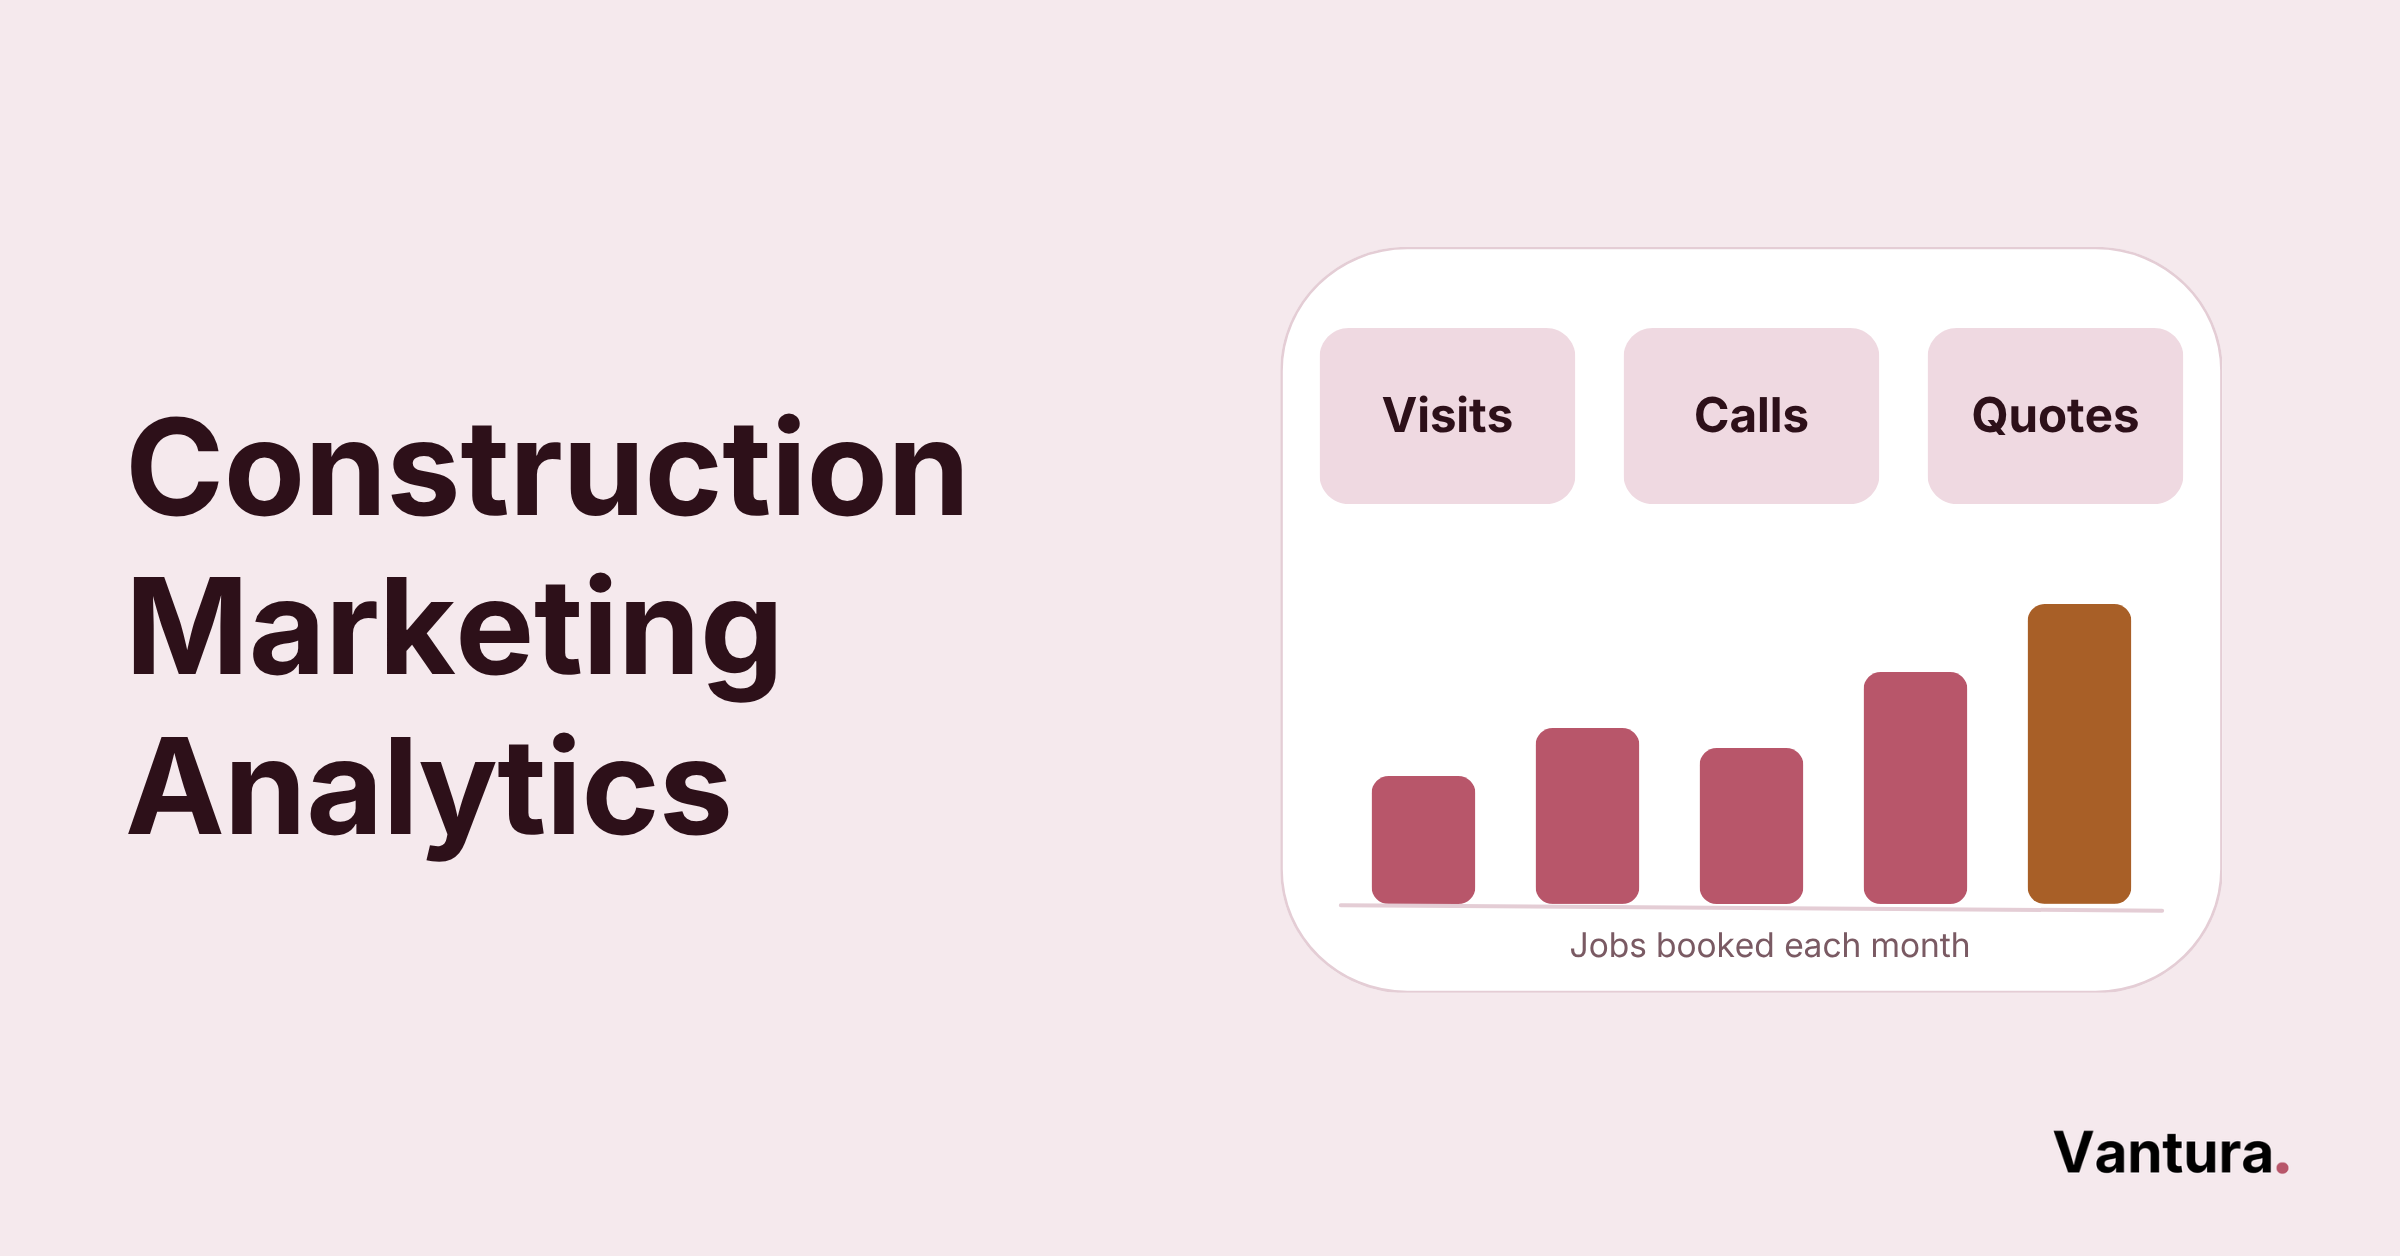
Construction marketing analytics measures how your campaigns, channels, and content perform, then turns that data into decisions that win more work. It pulls traffic, leads, and revenue into a handful of clear KPIs and dashboards your team can read at a glance. Track the right numbers and you stop guessing which marketing spend brings real construction jobs.
Why Trust Us With Your Construction Analytics:
Our team carries 190+ years in marketing and has run 750+ A/B tests across 14 industries, so we know which numbers predict booked work. That depth is why contractors lean on us to cut through dashboard noise.
Need Help Reading Your Numbers:
If your reports raise more questions than answers, reach out. We will turn them into a clear digital marketing audit tied to real projects. Get in touch whenever you want a second read on the data.
What Is Construction Marketing Analytics?
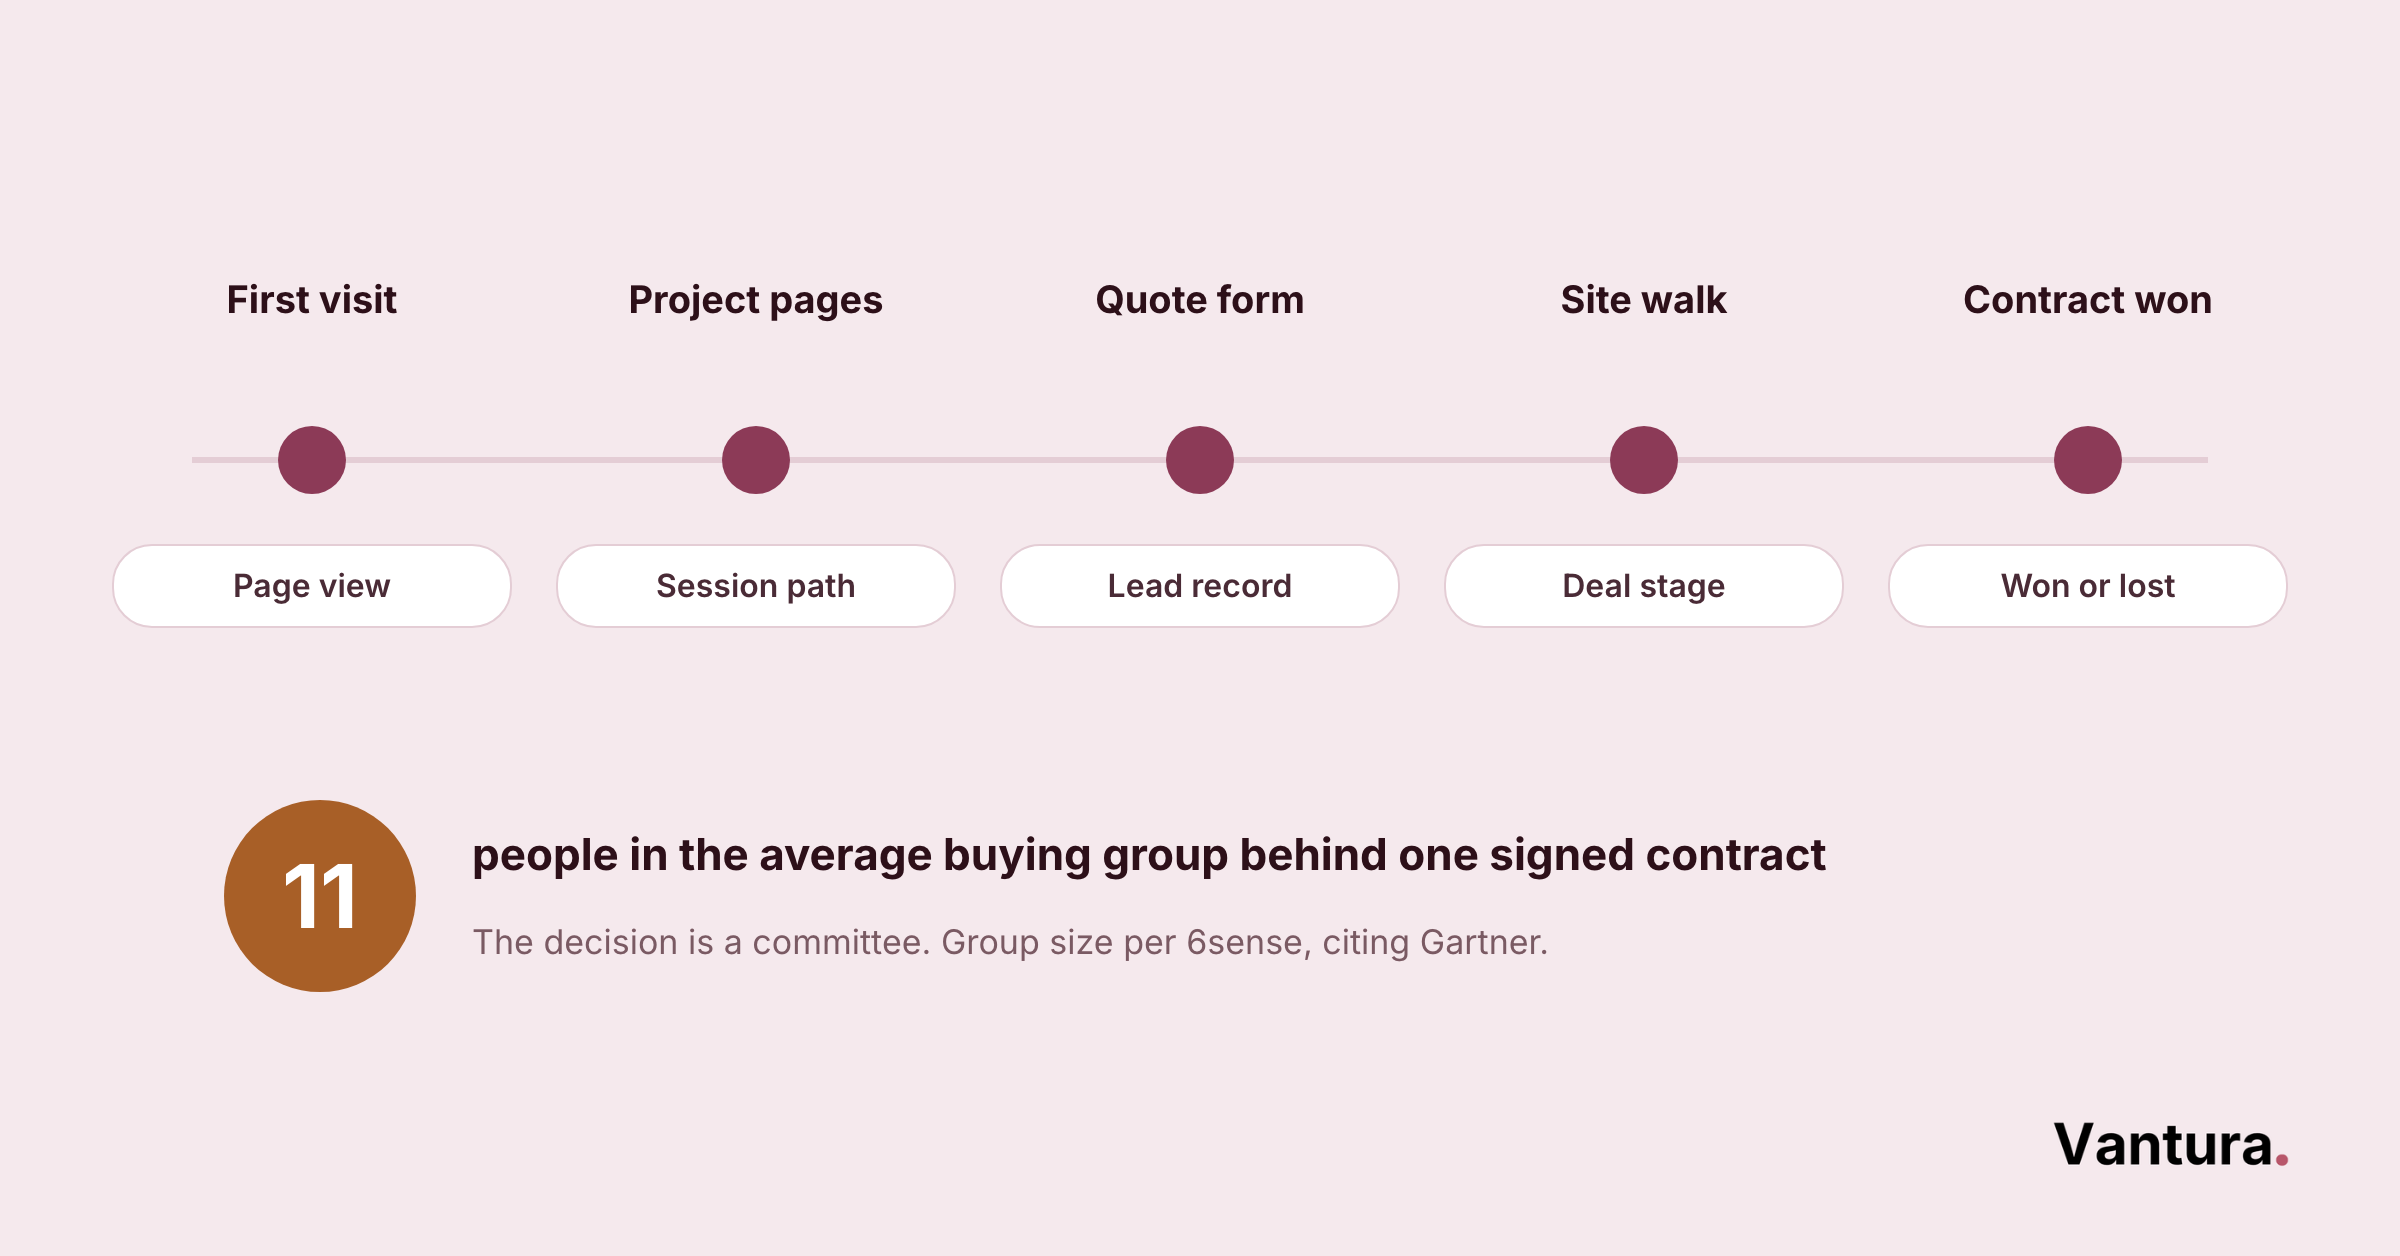
Construction marketing analytics is the practice of collecting the data your marketing creates and reading it to win more jobs. It covers the full path from a first website visit to a signed project, all in one view.
Think of it as the scoreboard for your marketing. Every ad, landing page, and form fill leaves a trace, and analytics gathers those traces into numbers you can act on.
For a contractor, that means seeing which channels bring real inquiries and which ones only spend money. It is the same clarity small business marketing teams chase every quarter. The goal is not more data, it is fewer, clearer answers.
Quick distinction: Analytics is not the same as reporting. Analytics digs into why a number moved, while a report just lists what the number was.
Why Does Construction Marketing Analytics Matter?
Construction marketing analytics matters because building jobs cost a lot to win and take months to close, so guesswork gets expensive fast. When you can see which touchpoints drive quote requests, you protect the spend that works and cut the spend that only looks busy.
Most trade and building firms run lean marketing teams, so every hour and dollar has to earn its place. Good analytics is how a small crew competes with a bigger one.
The wider industry backs this up. 45% of marketers say they are still struggling with measurement, according to Supermetrics. That gap is exactly why construction firms need clear numbers before scaling ad spend.
- Where your best leads really come from
- Which pages turn visitors into calls
- What each booked job costs you to win
Measure those three things and scattered activity becomes focused industrial marketing that ties back to real projects. Skip them and you are steering a truck with the windshield painted over.
Which Analytics Platforms Should Contractors Compare?
Most contractors need four kinds of tools working together, not one magic platform. You want website analytics, a CRM, call tracking, and a dashboard layer that stitches them into one picture.
| Tool type | What it answers | Best fit for |
|---|---|---|
| Website analytics | Where traffic comes from and what it does | Every contractor with a site |
| CRM | Which leads became quotes and jobs | Firms tracking a real pipeline |
| Call tracking | Which channel drove each phone lead | Phone-heavy trades |
| Dashboard tool | All of the above in one screen | Owners who want a single view |
We work across the big names and the niche, trade-specific tools too, and no vendor holds a stake in what we recommend. The right stack depends on your size and how your leads really reach you, not on who has the flashiest logo.
Setting Up Google Analytics for a Construction Website
Google Analytics is the free starting point for most contractors, and it does plenty on its own. The trick is setting it up so it counts inquiries, not just clicks.
- Install the tracking tag on every page of the site.
- Mark form fills and quote requests as conversions.
- Link it to your ad accounts so paid traffic is labeled.
- Filter out your own team and known bot traffic.
Setup tip: Set up conversion tracking before you spend a dollar on ads. Data you did not capture on day one is gone for good, and you cannot backfill it later.
How Do You Track Traffic Sources and Conversions?
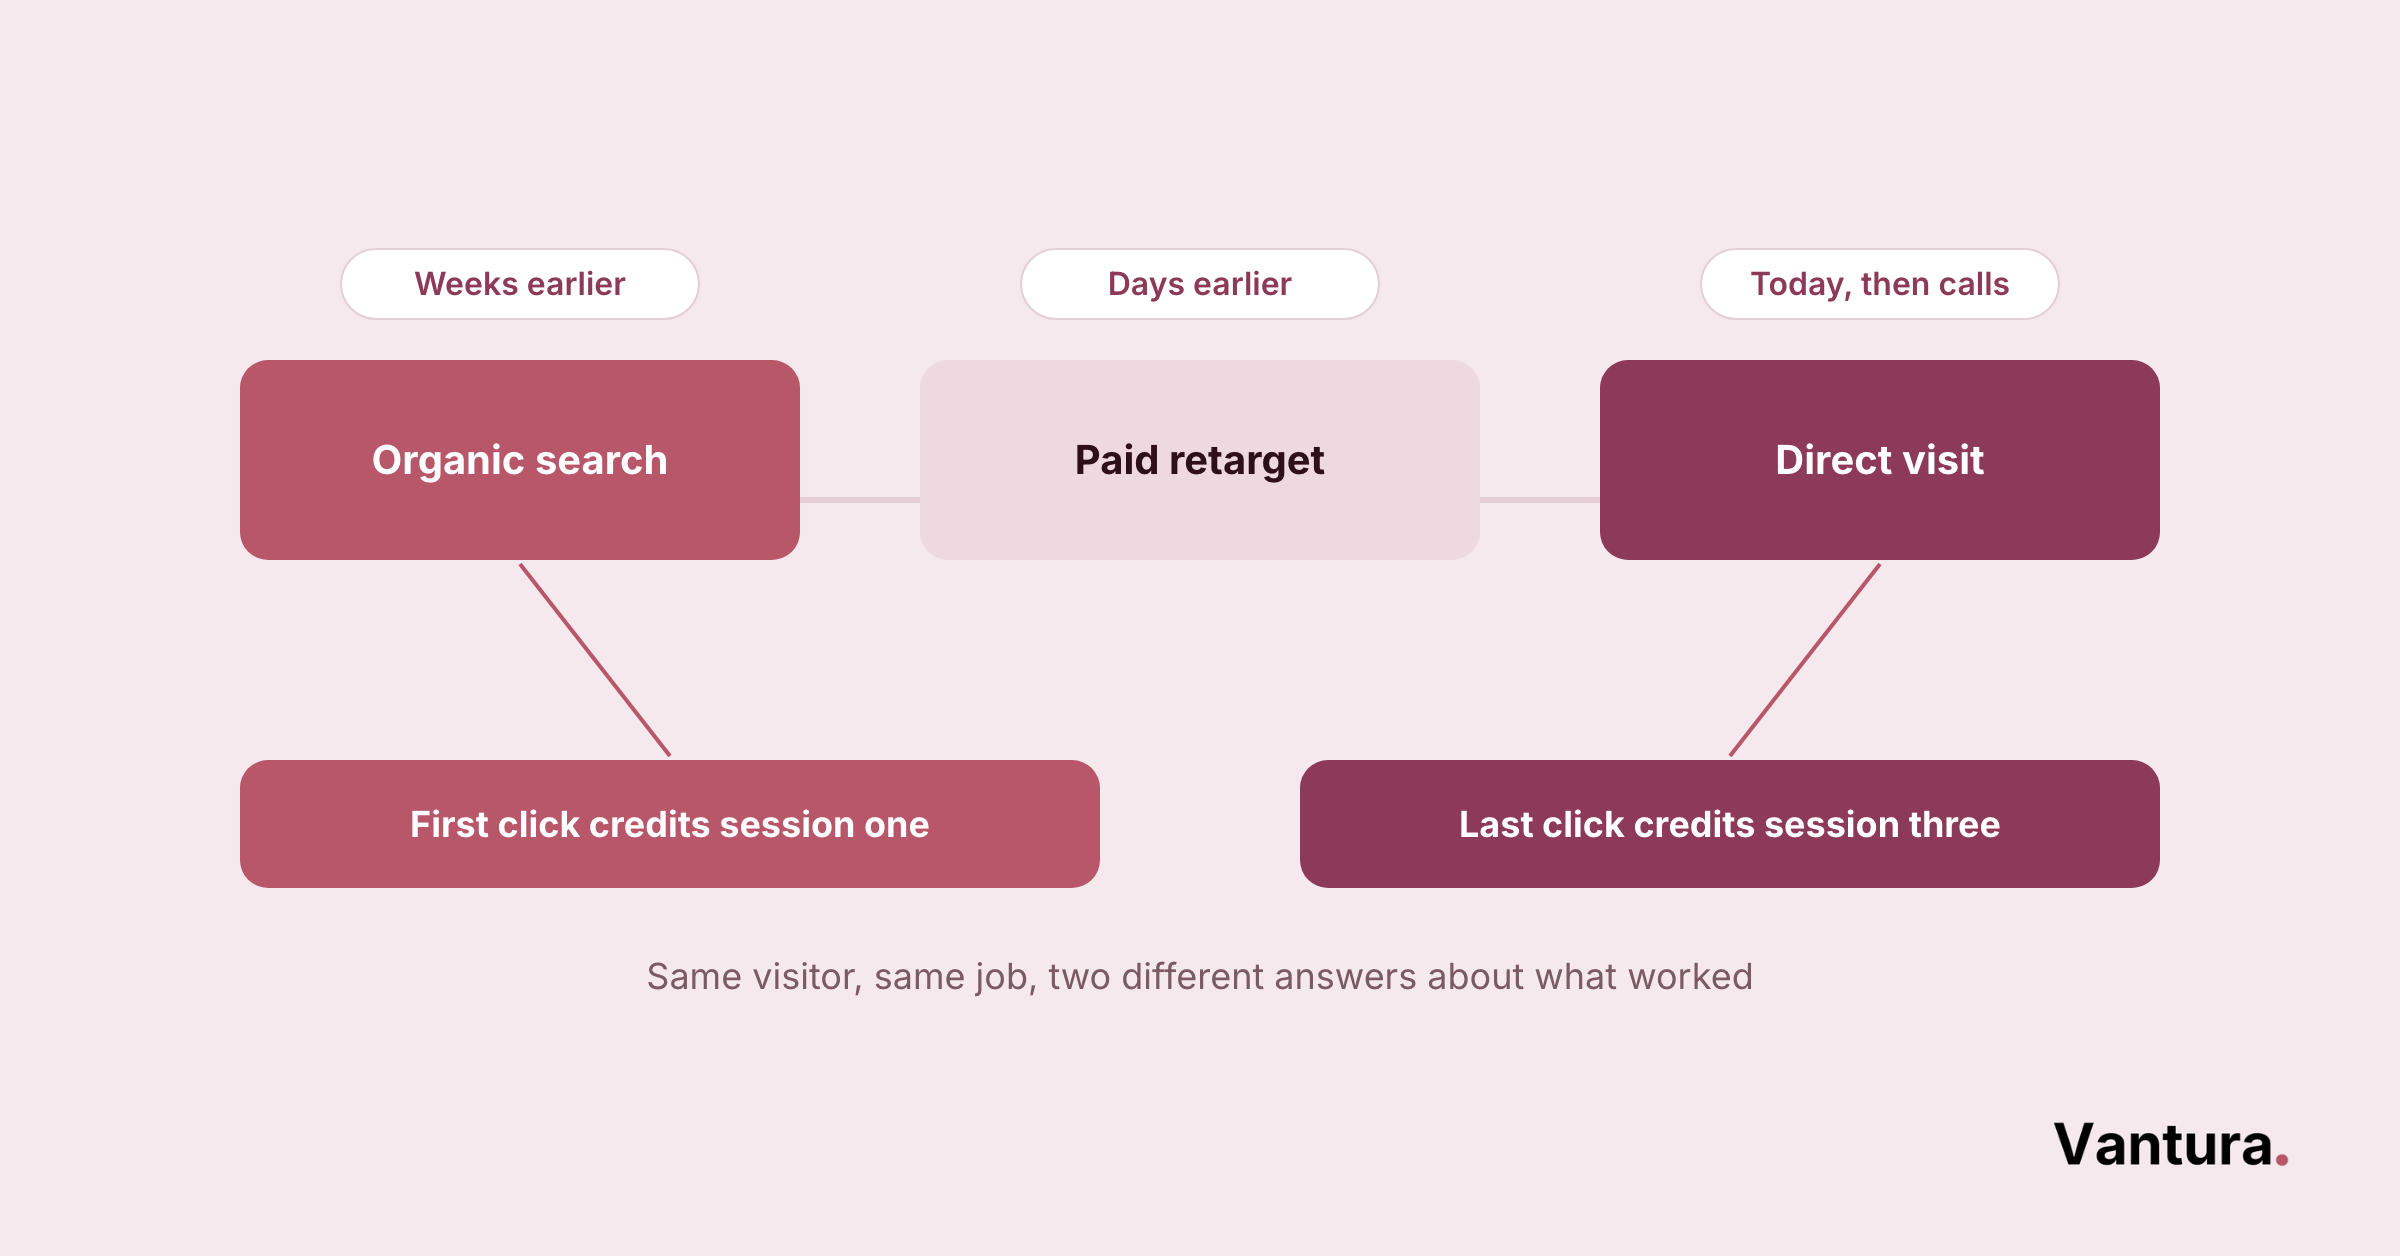
You track sources and conversions by tagging where visitors come from and marking the actions that matter as goals. Done right, you can follow a lead from a Google search all the way to a booked estimate.
Reading Construction Website Traffic by Source
Traffic splits into a few clear buckets, and each one tells a different story. Organic search shows your SEO working, and paid shows your ad spend. Direct often means word of mouth, or a truck someone spotted on a site.
Referral and social round out the picture. A content push through native ad campaigns shows up here, and watching this bucket tells you whether that reach turns into real visits.
Conversion Tracking Across Construction Marketing Channels
A visit means nothing until it becomes a lead. Conversion tracking ties each form fill, call, and quote request back to the channel that earned it.
For trades, phone calls are half the game, so call tracking is not optional. Without it, your best leads look like they came from nowhere and your reports quietly lie to you.
UTM Tags That Keep Your Data Clean
UTM tags are small labels you add to a link so analytics knows exactly where a click came from. They turn a vague source into a named campaign you can measure.
- Use lowercase, consistent names every time
- Tag every paid, email, and social link
- Never tag internal links on your own site
Which Channel KPIs Matter Most in Construction?
The KPIs that matter most are the ones tied to booked work, not applause. Each channel has one or two numbers worth watching, and the rest are usually noise.
| Channel | KPI that matters | What good looks like |
|---|---|---|
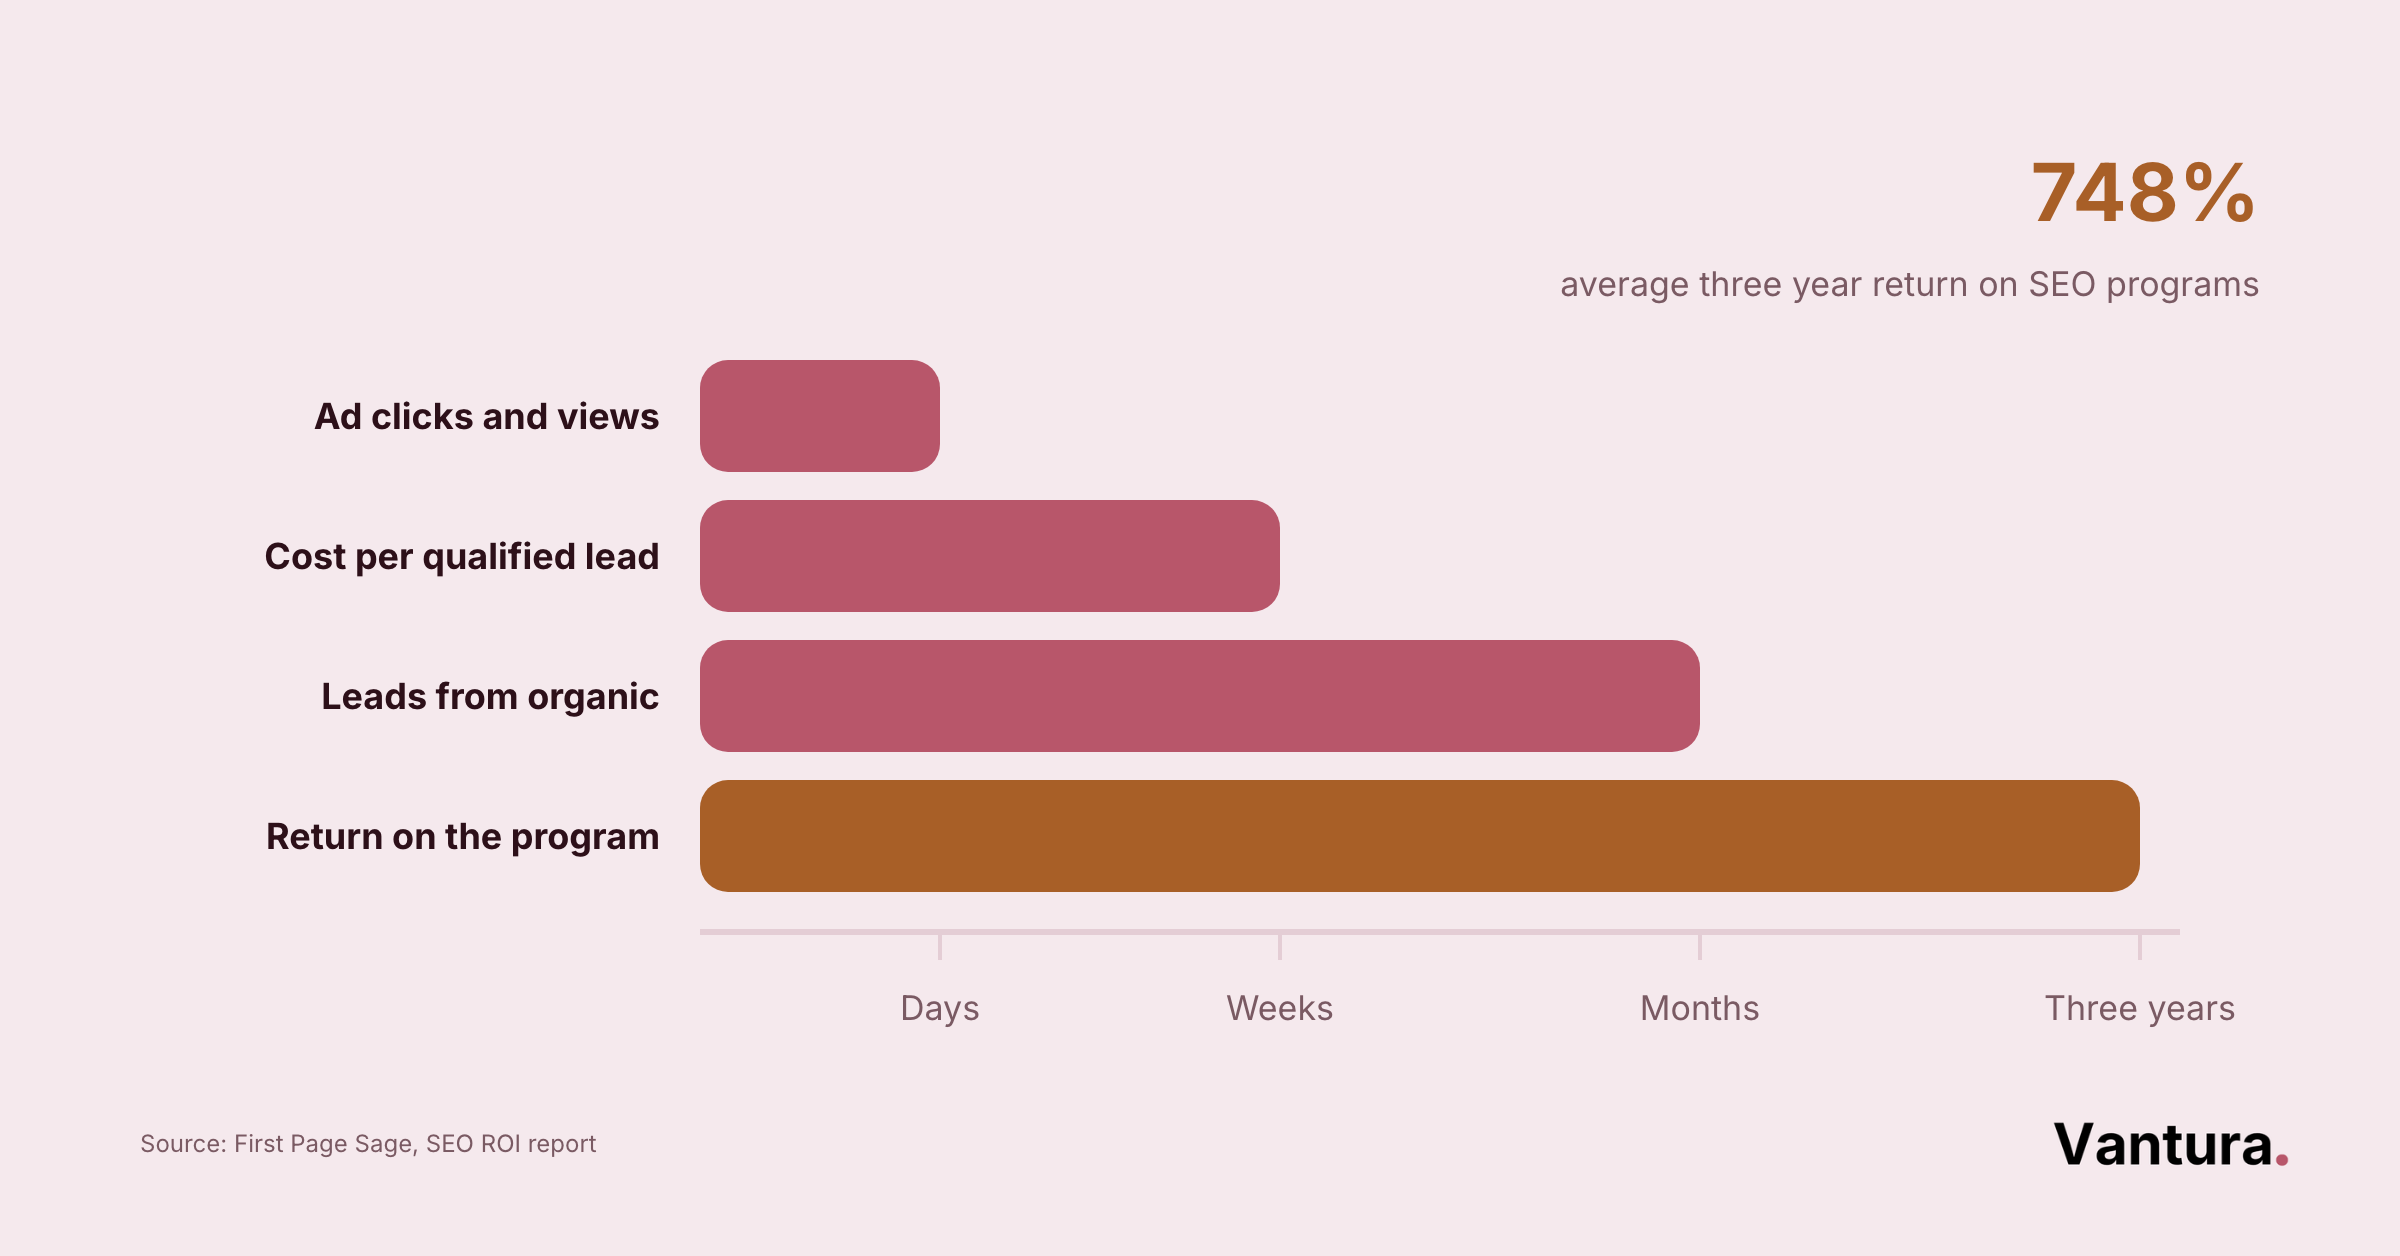
| SEO | Leads from organic search | Steady climb over months |
| Paid ads | Cost per qualified lead | Falling as you optimize |
| Social | Clicks and saved posts, not just likes | Traffic that converts |
| Reply and quote-request rate | Rising with better lists |
Construction SEO Performance Metrics
SEO is slow to build and hard to fake, which is why the numbers are so trustworthy once they move. Watch keyword rankings, organic leads, and how many map-listing views turn into calls.
Paid Campaign Analytics for Contractors
Paid channels give you the fastest feedback loop of anything you run. Cost per qualified lead is the number to obsess over, since a cheap click that never books work is still a waste.
Niche platforms deserve the same scrutiny as the big ones. If you test Reddit ad campaigns for a specialty trade, judge them on quotes booked, not on how many people saw the ad.
Social Media Analytics for Construction
Social is where vanity metrics do the most damage. A post with a thousand likes and zero site visits did nothing for your pipeline.
Visual platforms suit building work well, since before-and-after shots sell themselves. Tracking Pinterest ad performance against saved projects and clicks tells you whether that visual reach moves people toward a quote.
Email Campaign Analytics for Construction
Email quietly outperforms most channels on cost, and the metrics are refreshingly plain. Open rate hints at your subject lines, but reply rate and quote requests tell you if the list is worth mailing.
Now split every KPI you track into two camps. One tells you what already happened, the other hints at what is coming.
- Website visits from target areas
- New keyword rankings
- Quote requests in the pipeline
- Jobs booked last month
- Revenue per channel
- Return on total marketing spend
Worth knowing: Leading indicators warn you early, so a slow month of quote requests today predicts a slow month of revenue later. Watch them and you can fix trouble before it hits the bank.
How Do Buyers Move Through the Construction Funnel Online?
Construction buyers rarely go from first click to signed contract in one sitting. They research for weeks, compare a few firms, and often call only after several visits, so your analytics has to follow that whole journey.
Behavior reports show where people drop off. If most visitors leave the pricing page fast, that page, not your traffic, is the problem.
Longer sales cycles reward patient measurement. Mapping the path is core to strong B2B marketing. A decision here can involve an owner, an architect, and a project manager all at once.
Can Analytics Predict Which Construction Leads Convert?
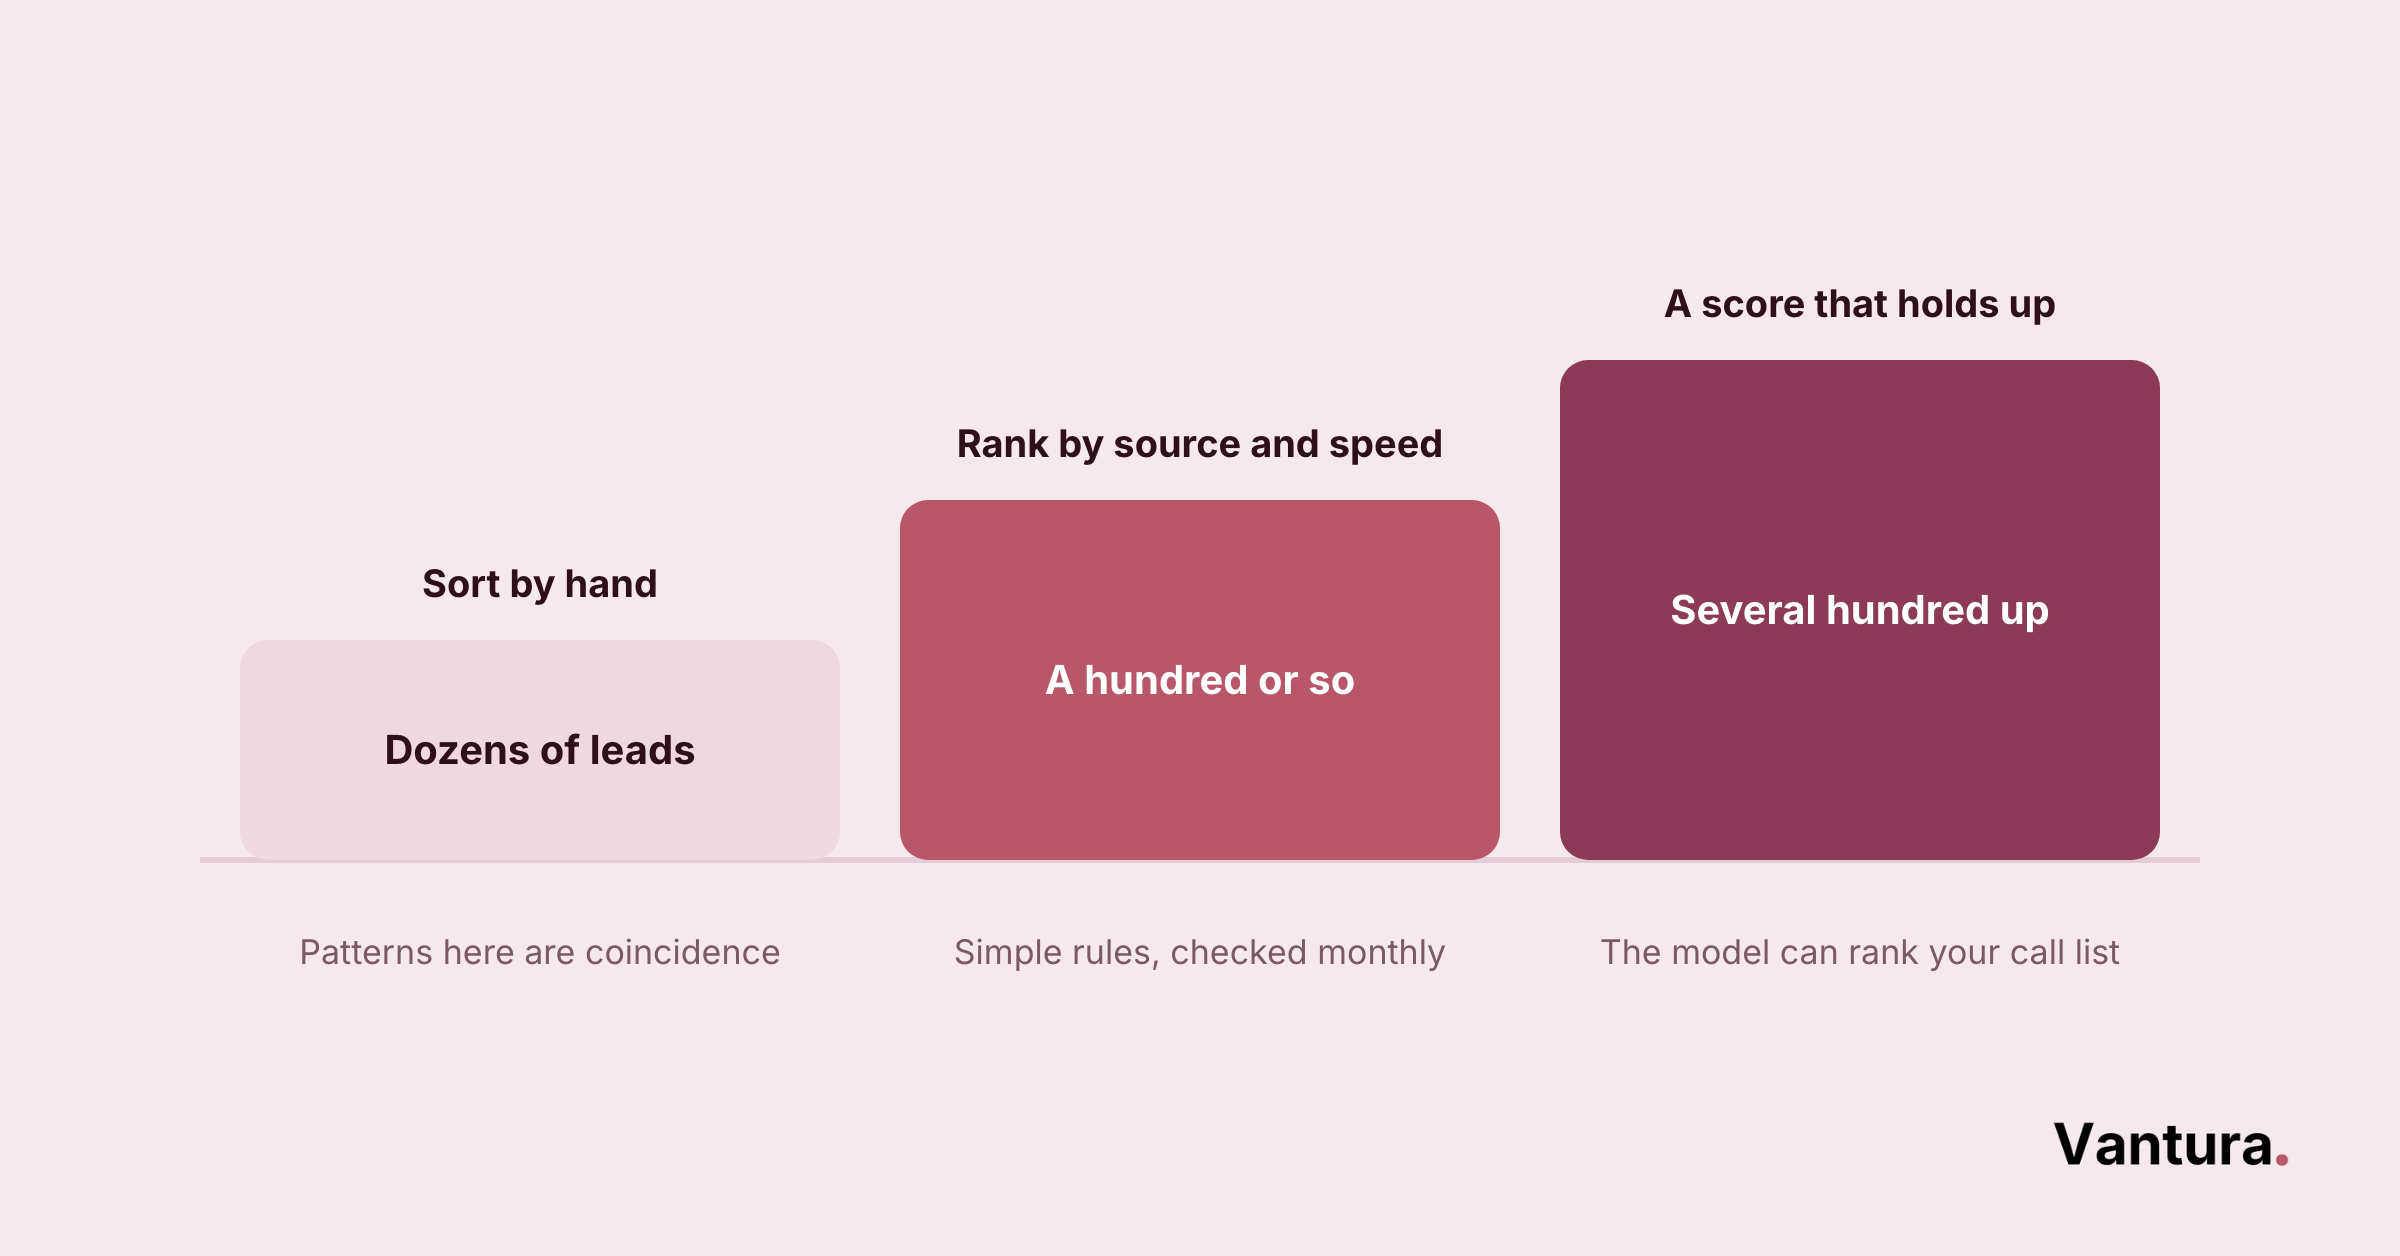
Yes, to a point. Predictive analytics reads patterns in past leads to flag which new ones look most likely to book. Your team can then call the hottest prospects first.
You need a decent pile of history before this works. In our experience, a contractor usually needs several hundred tracked leads before the patterns hold up, and below that it is still educated guessing.
Start simple with lead scoring based on source and behavior. If you want the heavier modeling done right, a little marketing consulting saves months of trial and error.
Reality check: Prediction narrows the odds, it does not read minds. Treat a lead score as a smart hint about where to spend your first call, not a promise of a signed job.
What Belongs on a Construction Marketing Dashboard?
A good dashboard fits on one screen and answers the questions an owner actually asks. It should show leads, cost, and revenue by channel without anyone digging through five tools.
- Leads this month versus last
- Cost per qualified lead by channel
- Quote requests and jobs booked
- Revenue traced back to marketing
Keep it boring on purpose, because a busy dashboard gets ignored. Tie the layout to your digital marketing strategy so every tile maps to a goal you set at the start.
How Do You Build a Construction Marketing Report?
A strong report tells a short story, moving from what happened to what you will do next. Build it the same way each cycle so anyone can follow it in a few minutes. Or hand the cycle to an outsourced marketing team if the hours are not there.
How Often Should Contractors Review Their Analytics?
Review cadence depends on what you are watching, since not every number deserves a daily look. A light weekly check plus a deeper monthly review covers most contractors well.
| Cadence | What you check | Who it is for |
|---|---|---|
| Weekly | Ad spend, leads, obvious problems | Whoever runs campaigns |
| Monthly | Cost per lead, channel trends | Marketing lead and owner |
| Quarterly | Revenue, ROI, strategy shifts | Leadership |
Checking too often leads to knee-jerk changes on noisy data. Pulling threads together into integrated campaigns is easier when you judge trends over weeks, not hours.
How Do You Report Marketing ROI to Construction Leadership?
Report ROI to leadership in the language they already use, which is jobs and dollars. Skip the marketing jargon and show spend in, revenue out, and the payback time between them.
Owners rarely care about impressions or bounce rate, the same rule enterprise marketing teams live by in board meetings. Across our projects, the fastest way to lose a room is to open with a metric that does not connect to booked work.
Bottom line: One clear sentence beats a wall of charts. If leadership cannot repeat your headline number after the meeting, the report did not land.
What Does Construction Marketing Analytics Mean for Data Privacy?
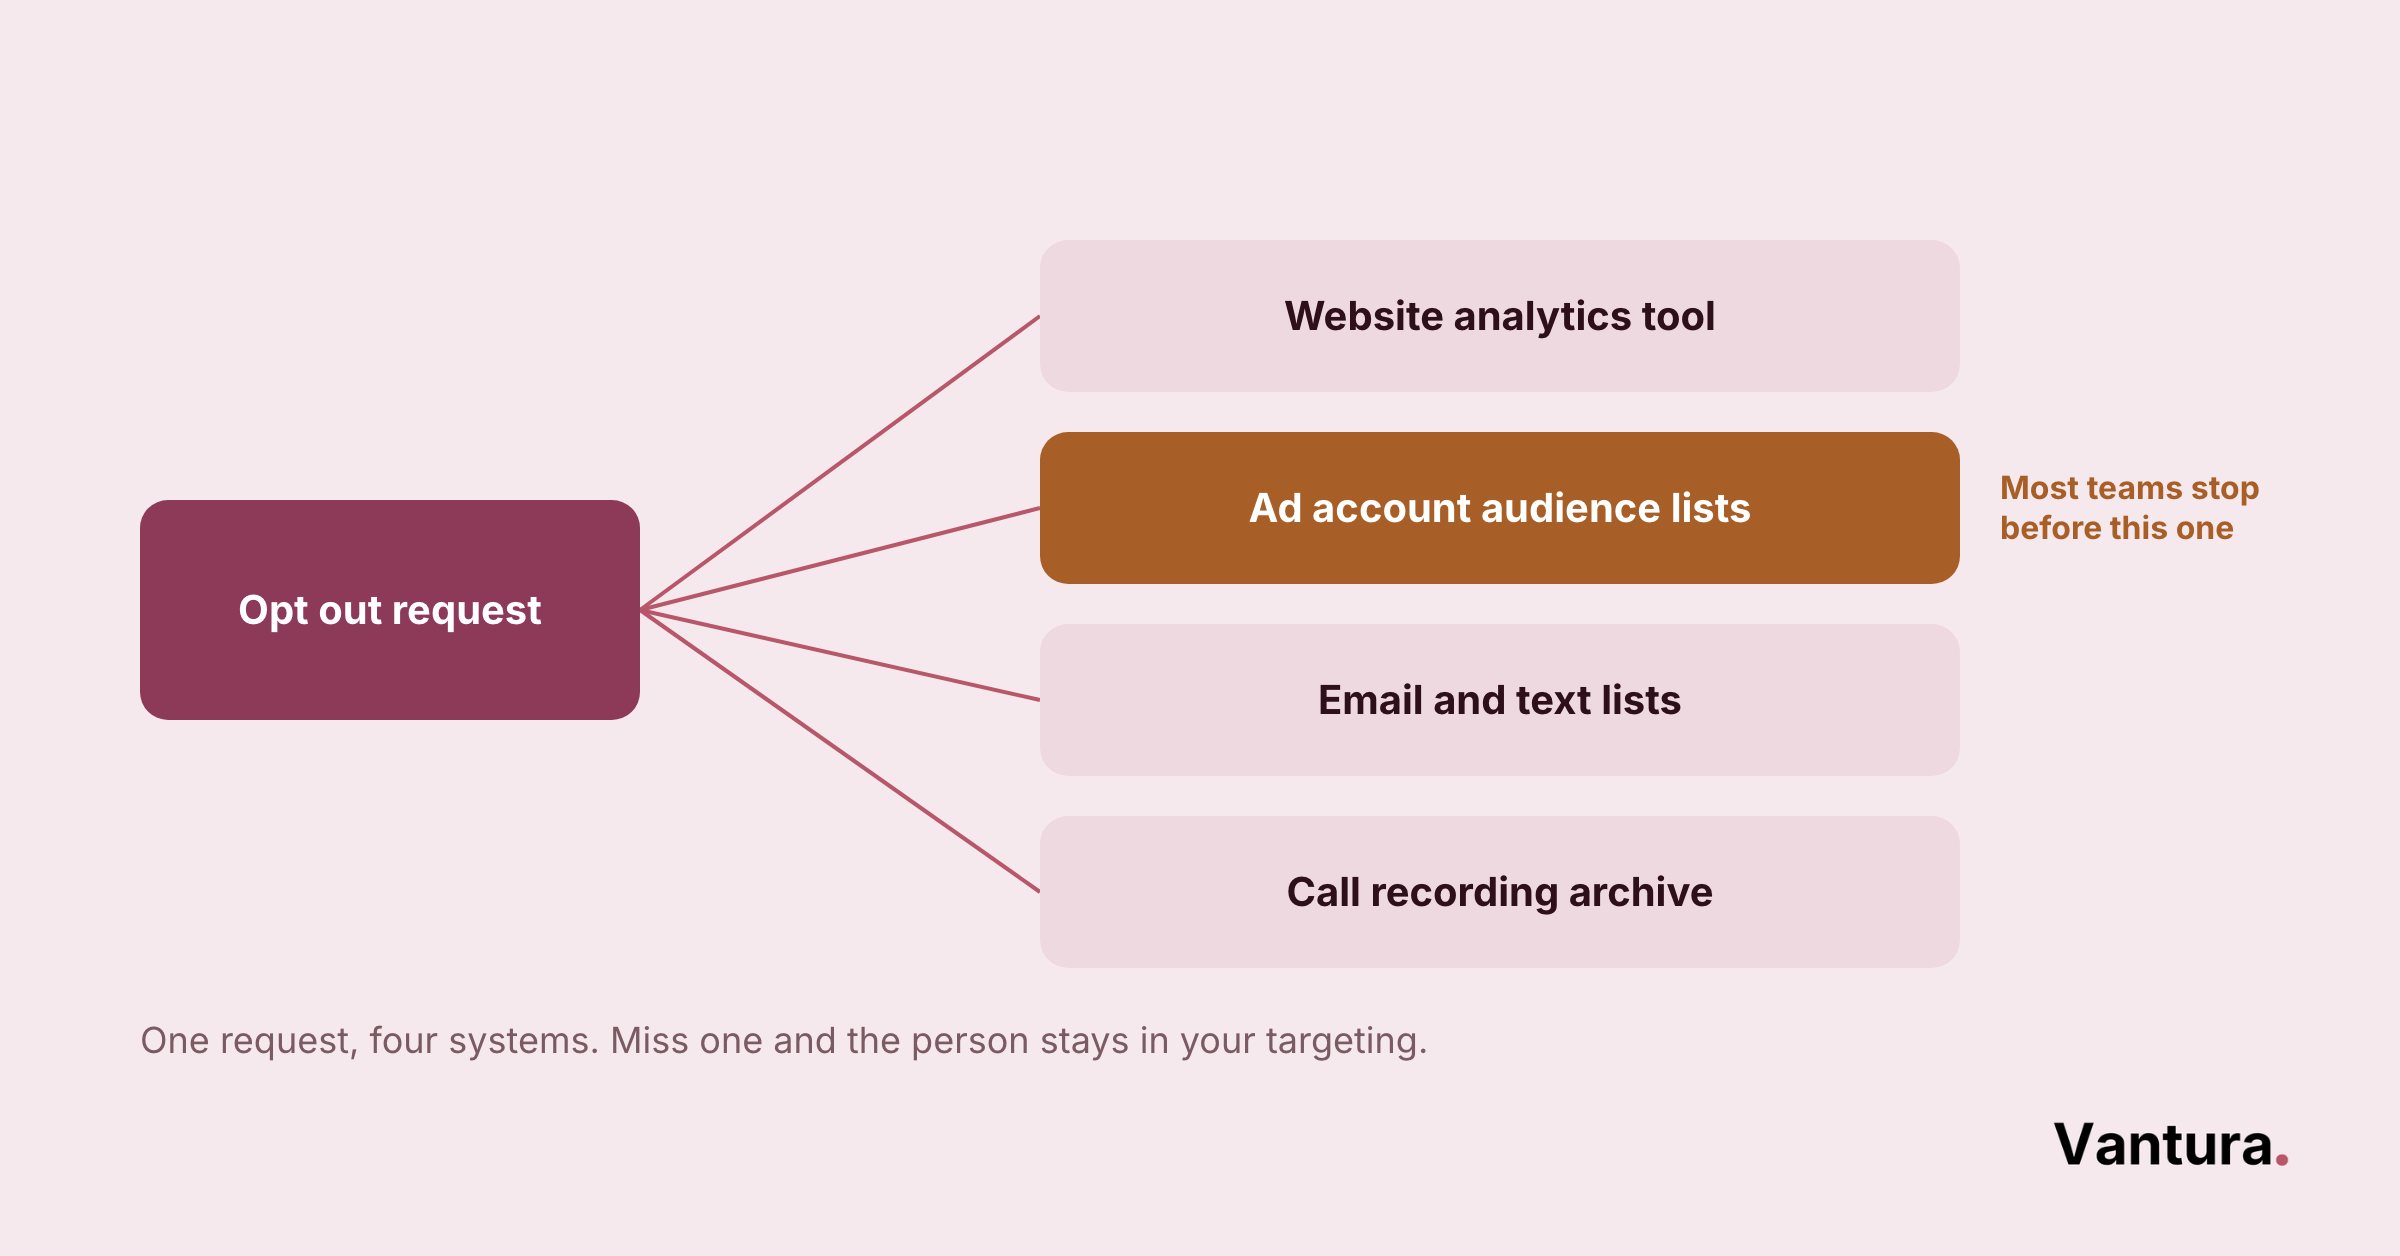
Analytics and privacy have to live together, since you are collecting real people’s data every day. Rules like consent banners and clear opt-outs are not just legal cover, they build trust with cautious buyers.
Keep the collection honest and the storage tight. Gather only what you will use, tell visitors plainly, and delete what you no longer need.
- Show a clear cookie consent notice
- Honor opt-out requests fast
- Limit who on the team sees raw data
How Can You Automate Construction Marketing Reporting?
You automate reporting by connecting your tools to a dashboard that refreshes on its own. Once it is wired up, the weekly scramble to copy numbers into a slide deck simply disappears.
Automation frees your team to read the data instead of assembling it. The catch is that a bad setup automates bad numbers, so the wiring has to be right before you trust it.
Start with one auto-updating dashboard, then add scheduled email summaries for the people who will not log in. Human judgment still writes the story, but the grunt work runs itself.
Common Construction Marketing Analytics Mistakes to Avoid
Most analytics failures are not technical, they are about watching the wrong things. A few habits trip up contractors again and again.
- Chasing likes and views that never become leads
- Skipping call tracking on a phone-driven business
- Judging slow channels like SEO on weekly swings
- Building reports nobody on the team reads
- Changing budgets on a single noisy data point
Avoid these and your data starts pulling its weight. The contractors who win with analytics are rarely the ones with the most tools. They are just the ones who watch the right handful of numbers and act on them.
Disclaimer: This article is for general information only and is not legal, financial, or professional marketing advice. Vantura Marketing makes no guarantee of specific results, and outcomes vary by market, budget, and execution. Confirm any privacy or compliance steps with a qualified professional before acting.